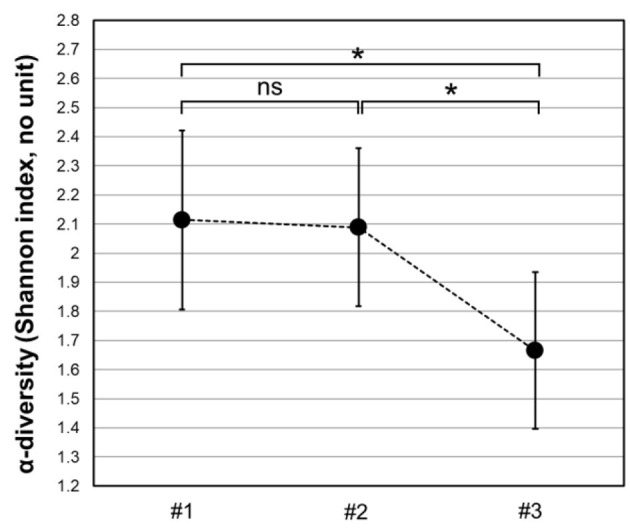
Figure 2.

Changes in the microbiome diversity over time and drastic effects on its relative diversity within bacterial families upon the dietary fiber consumption. The Shannon index expressed as a measure of the incidence and frequency of bacterial families in the test samples, ranged from 2.11 (#1) to 2.08 (#2), which was not a statistically significant difference (p-value > 0.05, Hutcheson's modified t-test, denoted ns—not significant). One month after consumption of the fiber mixture, the Shannon index dropped to 1.67, which was a significant decrease in the family diversity values (p-value < 0.05, Hutcheson's modified t-test, denoted by *). Error bars represent 95% CI for the calculated Shannon index. y-axis—Shannon index, without units. x-axis—sampling times. #1, time point week 1 (baseline); #2, time point week 27 (high training and competition period); #3, time point week 31 (after 30 days of dietary supplement intake).
