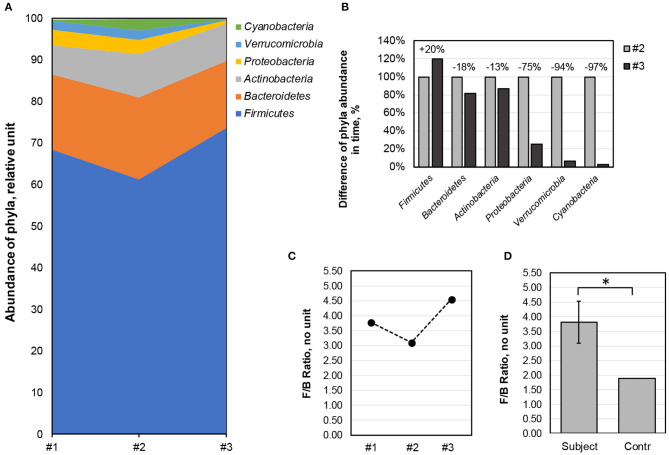
Figure 3.
Dynamic changes in bacterial phyla composition over the study period. (A) Changes in the abundance of the six most numerous phyla (Firmicutes, Bacteroidetes, Actinobacteria, Proteobacteria, Verrucomicrobia, and Cyanobacteria) in three serial samples (x-axis). y-axis—abundance of phyla, in relative units. (B) Proportional changes in the abundance of the six major phyla upon fiber consumption. The abundance of each phylum in sample #2 was equated to 100%, and the change in sample #3 relative to sample #2 is indicated above the columns. y-axis—relative abundance (%) of phylum in samples #2 and #3; x-axis—phyla. (C) Changes in F/B ratio over the 31-week study period, measured at three serial time points (x-axis). y-axis—F/B ratio. (D) The young athlete showed a high F/B ratio as compared with the control group (single mean t-test, p-value < 0.05, denoted by *). The bar graph represents the arithmetic mean of the F/B ratio in study samples and the error bars represent the standard deviation. y-axis—F/B ratio. #1, time point week 1 (baseline); #2, time point week 27 (high training and competition period); #3, time point week 31 (after 30 days of dietary supplement intake).

