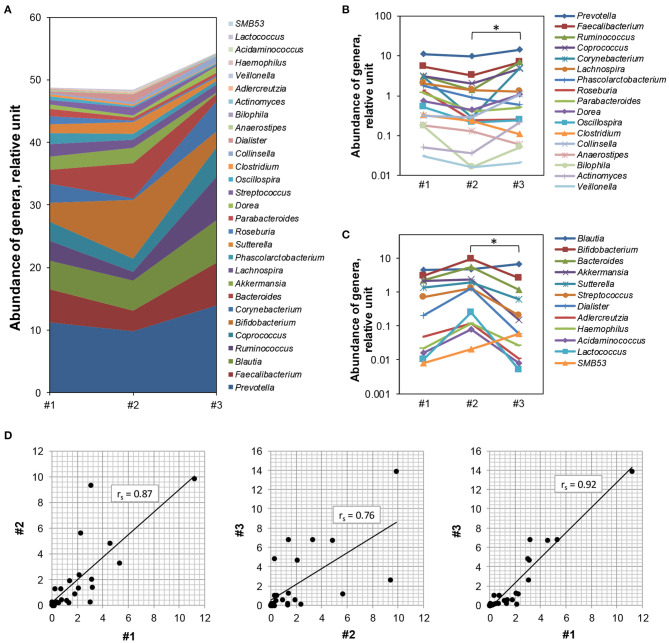
Figure 4.
Dynamic changes in bacterial genera composition during the study period. (A) The bacterial genera (n = 29) detected in all three samples at different time points (x-axis) are presented. y-axis—abundance of genera, in relative units. (B,C) Those species (n = 17) predominantly producing acetate had higher abundance in sample #2 compared with sample #1 but were significantly lower in sample #3 (Wilcoxon rank sum test, p-value < 0.05, denoted by *) (B), whereas, butyrate-producing species were higher in sample #3 and low in samples #1 and #2 (Wilcoxon rank sum test, p-value < 0.05, denoted by *) (C). x-axis—serial time points; y-axis—abundance of genera, in relative units. The number of bacterial genera is plotted in logarithmic scale. (D) Correlations between the differential abundance of large bacterial genera (n = 29) in the microbiome composition. The difference was high before vs. after the intake of fiber [sample #2 vs. #3, middle graph, Spearman's correlation coefficient rs = 0.76 (p < 0.0001)], as compared with that at the beginning and the end of the intense training period [sample #1 vs. #2, left graph, Spearman's correlation coefficient rs = 0.87 (p < 0.0001)], and also to that at the beginning and the end of the study [samples #1 and #3, Spearman's correlation coefficient rs = 0.92 (p < 0.0001)]. x- and y-axes—abundance of genera, in relative units. #1, time point week 1 (baseline); #2, time point week 27 (high training and competition period); #3, time point week 31 (after 30 days of dietary supplement intake).

