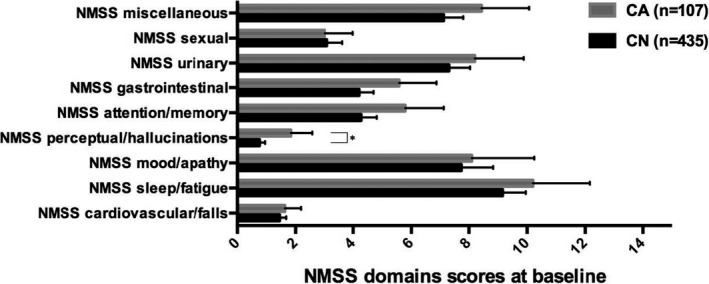
FIGURE 1.

NMSS domains scores between the study groups at baseline. Data presented as mean and 95% confidence intervals (bars). CA, cognitively abnormal (MMSE score of ≤ 25 at follow‐up); CN, Cognitively normal (MMSE score of ≥26 at follow‐up). * Indicates a p value of .024 (Quade's rank analysis of covariance correction for age and Benjamini‐Hochberg procedure correction for multiple testing); The NMSS Score for each item is based on a multiple of severity (from 0 to 3) and frequency (from 1 to 4) scores
