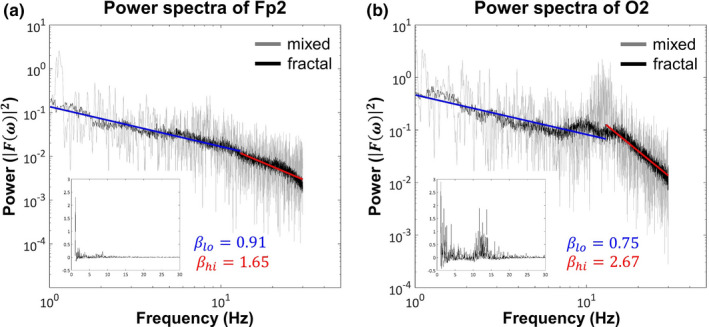
FIGURE 1.

Mixed, fractal, and oscillatory spectra. Illustrative examples are shown from regions Fp2 (a) and O2 (b) with markedly different spectral characteristics. On both panels, the original/mixed PSD is marked in gray and the separated fractal component in black. The two distinct scaling ranges (low: 1–13 Hz, marked in blue; high: 13–30 Hz, marked in red) with different spectral exponents (slopes) are apparent, especially in case of O2. The inset plots show the spectra of the corresponding extracted oscillatory components, which are obtained by subtracting the fractal component from the original (mixed) spectrum. Strong alpha activity is apparent over O2 and relatively absent over F8
