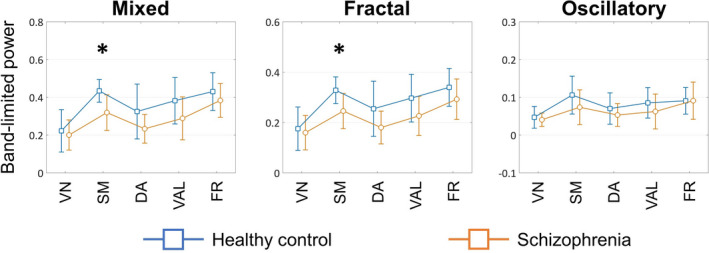
FIGURE 5.

Between‐group differences in corresponding RSNs in delta‐band BLP. Asterisk symbols mark differences that were found significant following FDR correction with level . RSN = resting‐state network; BLP = band‐limited power; FDR = false discovery rate; VN = visual network; SM = somatomotor; DA = dorsal attention; VAL = ventral attention‐ and limbic; FR = frontal
