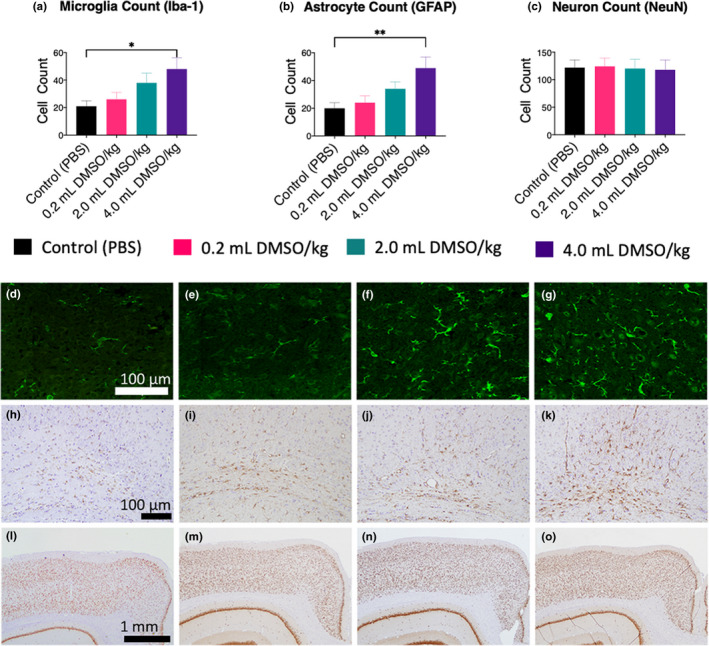
FIGURE 2.

Immunohistochemical analysis of microglia, astrocytes, and cortical neurons in adult rats (P40) following neonatal exposure to DMSO at P6‐10 (n = 24, 6/group). Tissue was collected and prepared as described in the methods. Data were collected in a randomized, blinded manner by two neuroscientists. (a–c) Quantitative analysis of microglia, astrocytes, and neurons. (d–g) Representative immunohistochemical stains showing an increase in microglia (Iba‐1 stain) with increasing DMSO doses; (d) control; (e) 0.2 ml DMSO/kg; (f) 2.0 ml DMSO/kg; (g) 4.0 ml DMSO/kg (size bar = 100 µm). (h–k) Representative immunohistochemical stains showing an increase in astrocytes (GFAP stain) with increasing DMSO doses; (h) control; (i) 0.2 ml DMSO/kg; (j) 2.0 ml DMSO/kg K); 4.0 ml DMSO/kg (size bar = 100 µm). (l–o) Representative immunohistochemical stains showing no change in cortical neurons (NeuN stain) with exposure to DMSO; (l) control; (m) 0.2 ml DMSO/kg; (n) 2.0 ml DMSO/kg; (o) 4.0 ml DMSO/kg (size bar = 1 mm). Values are represented as means ± SEM; *p < .05 versus sham‐treated control (PBS); **p < .01 versus sham‐treated control (PBS)
