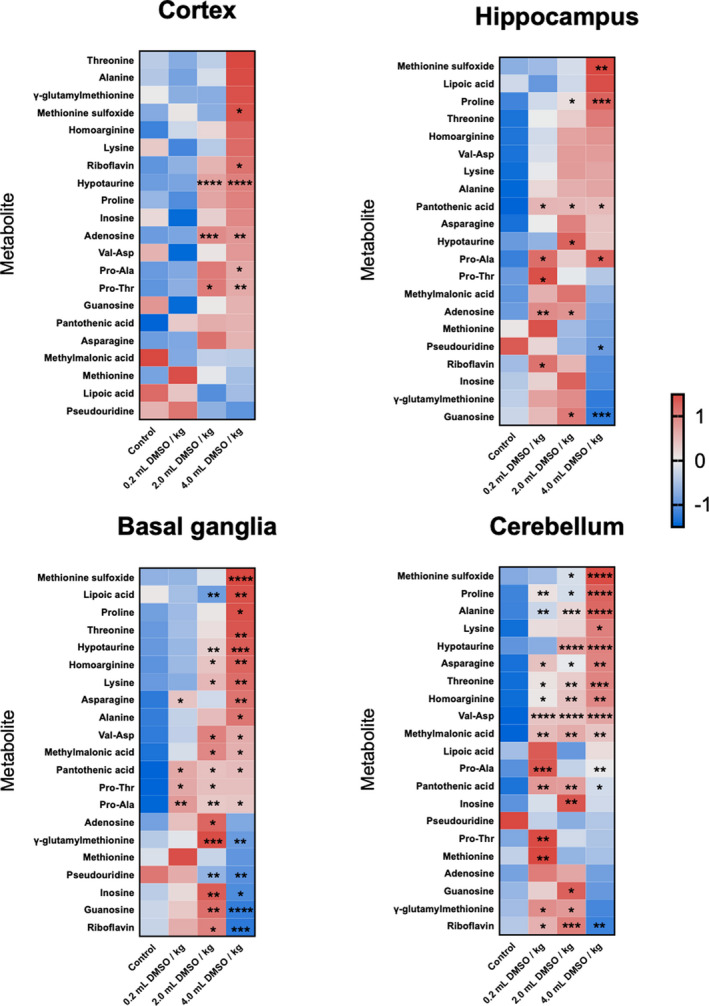
FIGURE 5.

Heat map visualization of metabolites involved in nucleic acid and protein metabolism in the brain 24 hr after DMSO exposure (n = 20, 5 per group) measured using HILIC‐Q Exactive HF MS/MS following Z‐score transformation. p‐values for each metabolite are indicated by asterisks. Averages for each compound are shown to indicate fold change magnitude and direction. *p < .05 versus control (PBS); **p < .01 versus control (PBS); ***p < .001 versus control (PBS); ****p < .0001 versus control (PBS)
