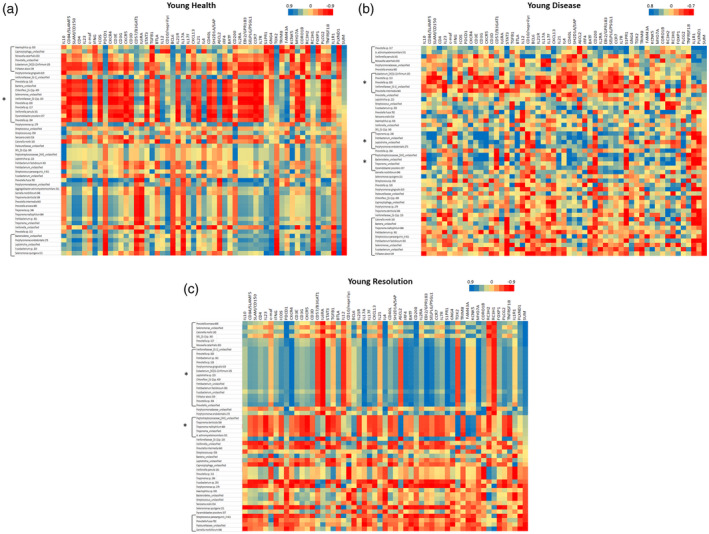
Fig. 6.

Heat‐map of correlations between bacterial operational taxonomic units (OTUs) relative abundance and individual gene expression young healthy (a), diseased (b) and resolution (c) samples. Data are sorted based upon SUM that represents a summation of transcript levels for the composite of 12 follicular T helper (Tfh) genes. Brackets identify bacterial clusters correlated positively or negatively with the composite Tfh gene footprint. Brackets with asterisk (*) identify bacterial clusters broadly correlated with an array of the Tfh genes but not directly correlated with the composite profile.
