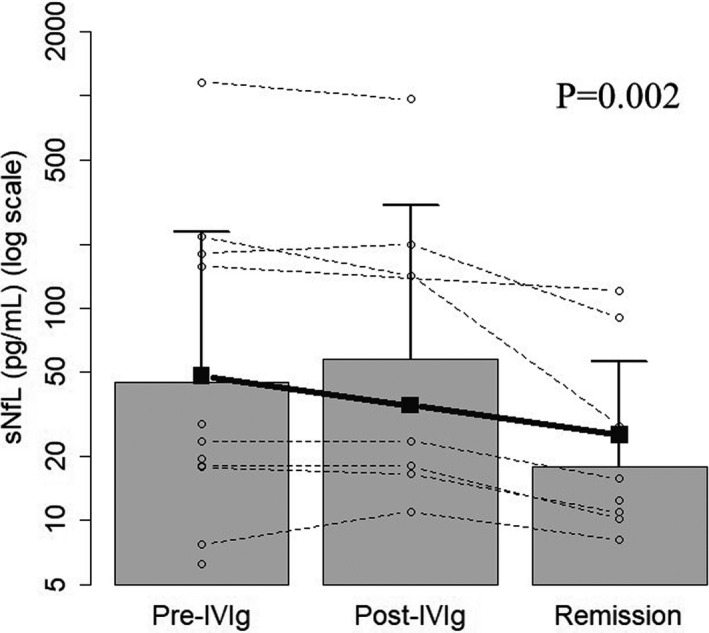
FIGURE 3.

Changes in sNfL levels in each individual patient with CIDP at different disease phases of Pre‐IVIg, Post‐IVIg, and remission. The sNfL levels significantly decreased overtime after one month of treatment and in remission period. Closed squares represent means. Longitudinal time‐effects are presented with trend test based on linear mixed regression model and p‐value
