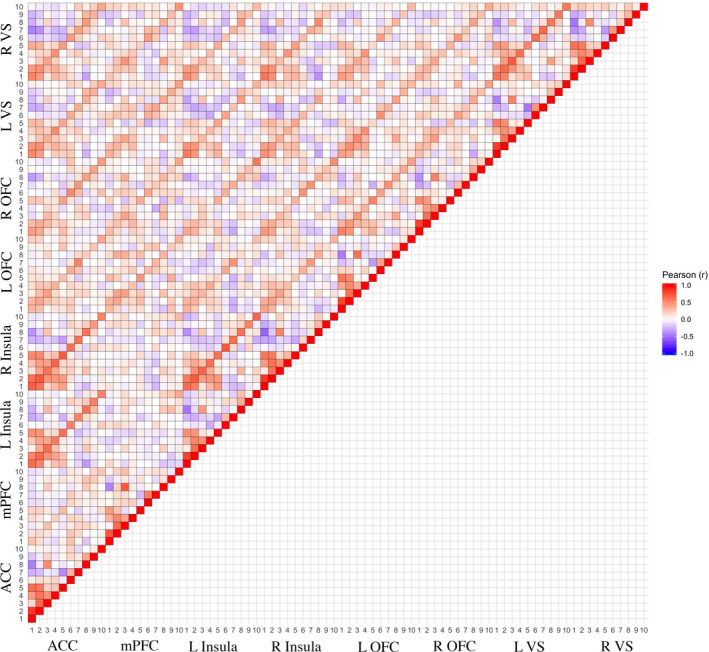
FIGURE 2.

Pearson correlation matrix of 10 contrasts by 8 ROI’s. Color bar represents the associated Pearson's r value between the 10mm ROI across 10 contrasts. See Table 1 for associated contrast information. R = right; L = left; VS = ventral striatum; OFC = orbitofrontal cortex; mPFC = medial prefrontal cortex; ACC = anterior cingulate cortex
