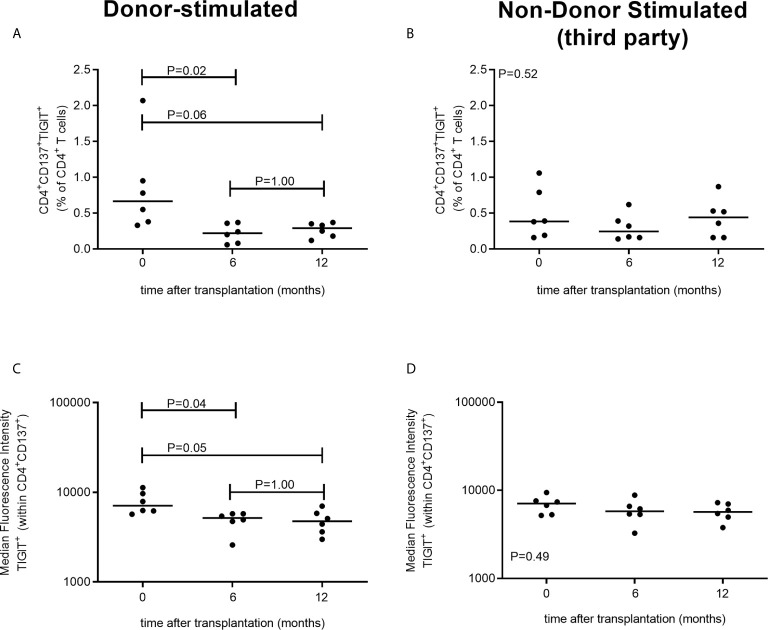
Figure 3.
TIGIT-expressing donor-reactive CD137+ CD4+ T cells significantly decline within first 6 months following transplantation. The two panels on the left (A, B) represent PBMCs stimulated with donor-antigen while those on the left (C, D) represent PBMCs stimulated with non-donor (third party) antigen. In the top panels the percentage of CD4+ T cells co-expressing CD137 and TIGIT is illustrated prior to transplantation (timepoint 0) and at 6 and at 12 months following transplantation for 6 kidney transplant recipients per timepoint. In the bottom panels the MFI of TIGIT-expressing cells within the CD4+CD137+ T cell population is depicted.

