
Figure 5.
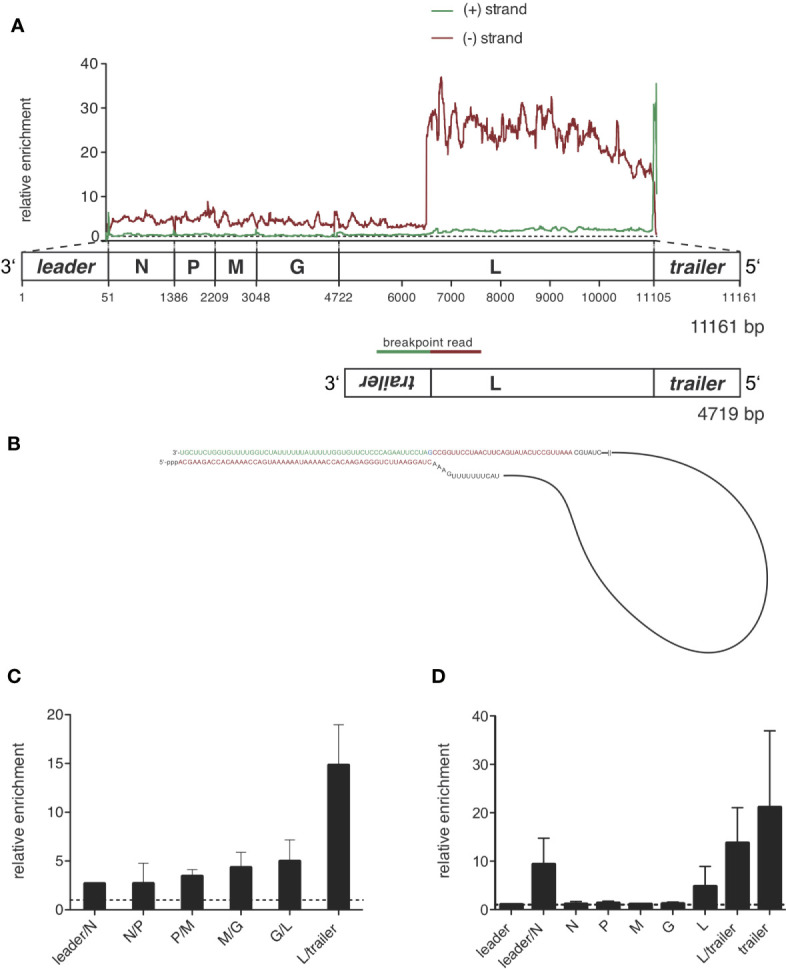
Sequencing of RIG-I-associated RNAs after VSV infection reveals a 4719 nucleotides long panhandle defective-interfering genome and the full length VSV genome as specific ligands bound to RIG-I. HEK 293 cells (40 x 106) expressing either FLAG-RIG-I or not were infected with VSV (MOI=1). 9 hours later lysates were prepared and RIG-I/RNA complexes were immunoprecipitated with anti-FLAG antibody-coupled sepharose beads. After elution RNA was purified from the eluate. (A) cDNA libraries were generated and sequenced on an Illumina genome analyzer. The read sequences were aligned to the VSV genome reference and the coverage, meaning the number of sequence reads that cover each specific position of the reference genome represented on the x-axis was determined. Data show the relative enrichment on the y-axis by calculating the ratio of the coverage at each position in samples containing RIG-I divided by the coverage in the negative control without RIG-I. The x-axis has a resolution of single-nucleotide positions. A schematic representation of the VSV genome underlines the x-axis and is in areas of the trailer and leader sequences not true to scale. The analysis was performed separately for sequences aligning to the VSV genome in positive orientation (green) and negative orientation (red). One representative experiment out of two is shown. (B) Model of the detected 4719 nucleotides long panhandle DI genome. Breakpoint-containing reads covering the L-gene in negative orientation and the inverse complementary trailer sequence were found in the NSG libraries and are highlighted in red and green as basis for the DI genome model. (C) Depicted is the relative enrichment (coverage in samples containing RIG-I/coverage in the negative control without RIG-I) of NGS reads covering intergenic sequences between two genes in negative orientation. These sequences are uniquely contained in the genomic sequence of VSV. Data are shown as the mean + SD of two independent experiments. No leader/N intergenic read was detected in the control of one of the experiments. To avoid zero as the divisor here only n=1 is given. (D) RNA from the eluate was transcribed into cDNA and specific primer sets were used to detect the indicated genomic regions by RT-qPCR. The viral RNAs were normalized to the unspecifically bound HPRT sequences and are depicted as relative enrichment (copies/HPRT reads in samples containing RIG-I divided by copies/HPRT reads in the negative control without RIG-I). Data are shown as mean plus SD of n=1 (leader, M, G), n=2 (L-trailer) or n=3 (Leader-N, N, P, L, trailer).