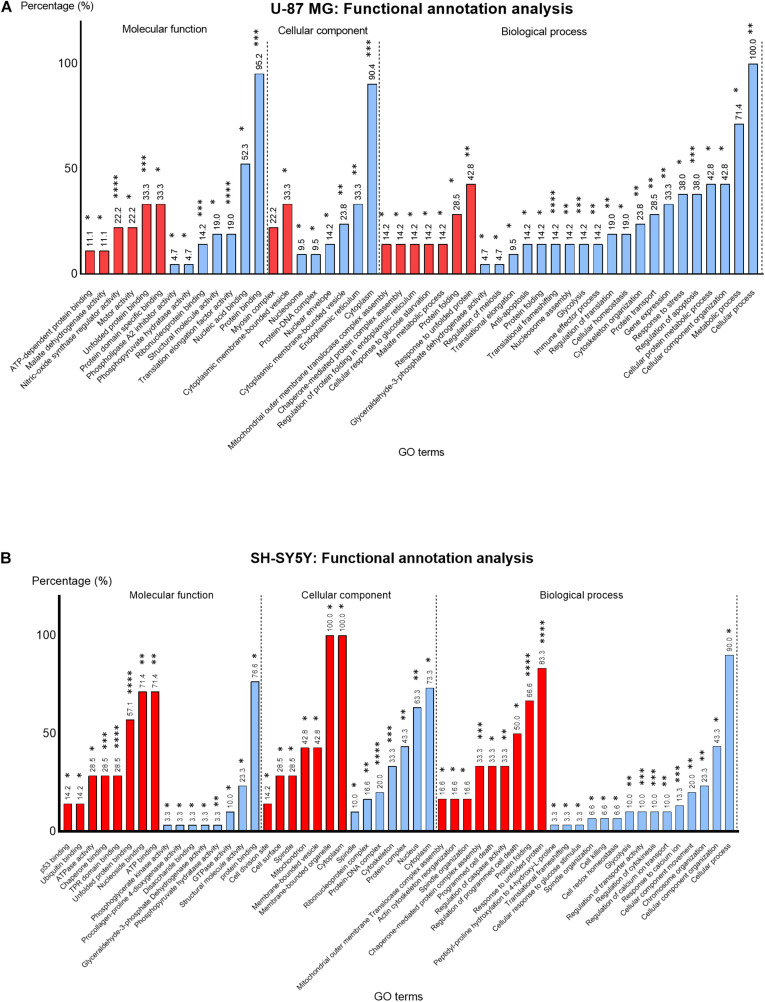
FIGURE 6.
Percentage (%) of up- (red) and downregulated (blue) proteins identified in MS13-treated (A) U-87 MG and (B) SH-SY5Y cells annotated to each statistically enriched GO term for functional categories “Molecular function,” “Cellular component,” and “Biological process.” The number above each bar represents the percentage of protein of the respective GO terms while the asterisks indicate the false-discovery rate (FDR) (p-value) of each GO term upon multiple correction statistical test using the Benjamini–Hochberg procedure. *p < 0.05; **p < 0.01; ***p < 0.001; ****p < 0.0001.

