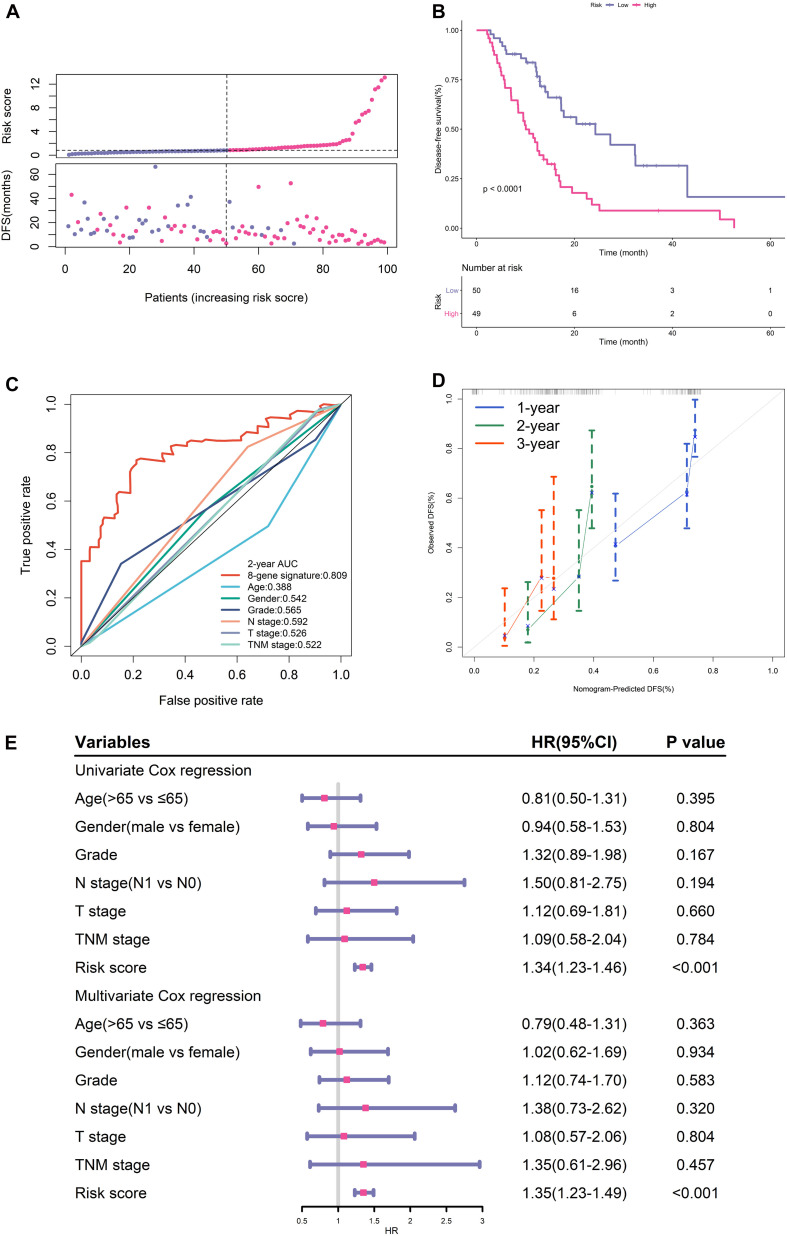
FIGURE 2.
Prognostic performance of gene signature in TCGA training cohort. (A) From top to bottom are the risk score distribution and survival status distribution. (B) K-M survival curve for risk score. (C) ROC curve of the risk signature and clinical predictors. (D) Calibration curves for risk score. (E) Univariate and multivariate cox regression analyses of clinical parameters and gene signature for DFS.

