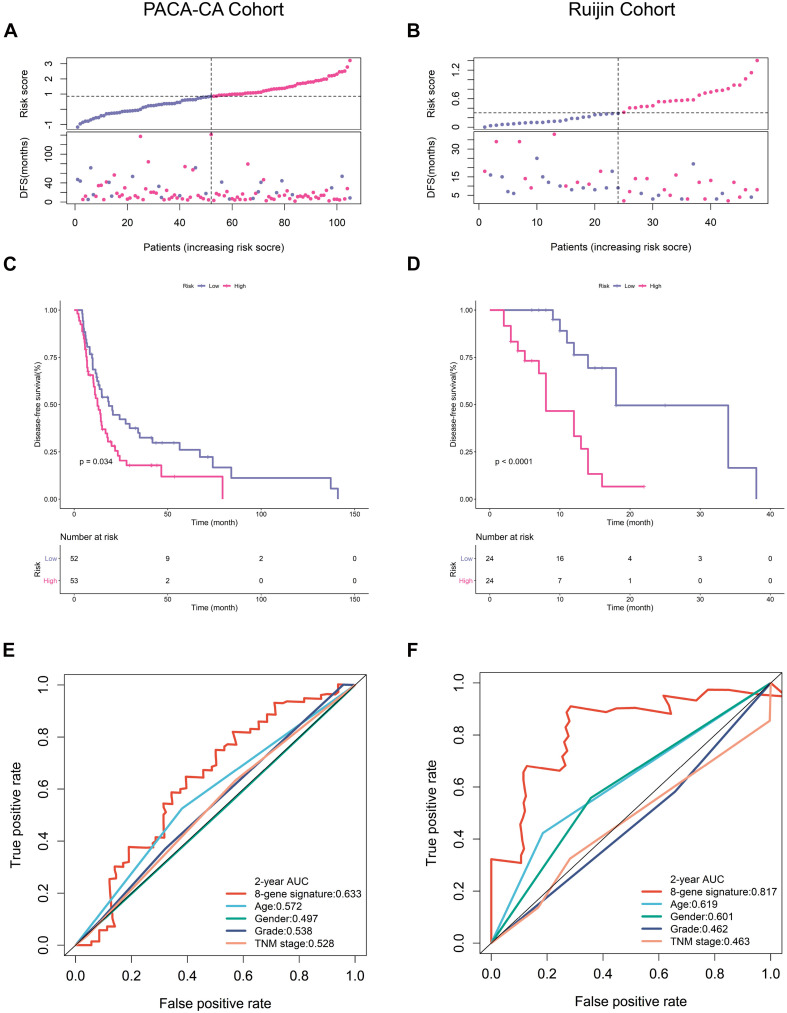
FIGURE 3.
Prognostic validation in PACA-CA and Ruijin cohorts. (A,B) Distribution of risk score and survival status in PACA-CA and Ruijin cohorts, respectively. (C,D) K-M survival curves estimating DFS difference in two cohorts. (E,F) ROC curves of risk signature and clinical indicators in two cohorts.

