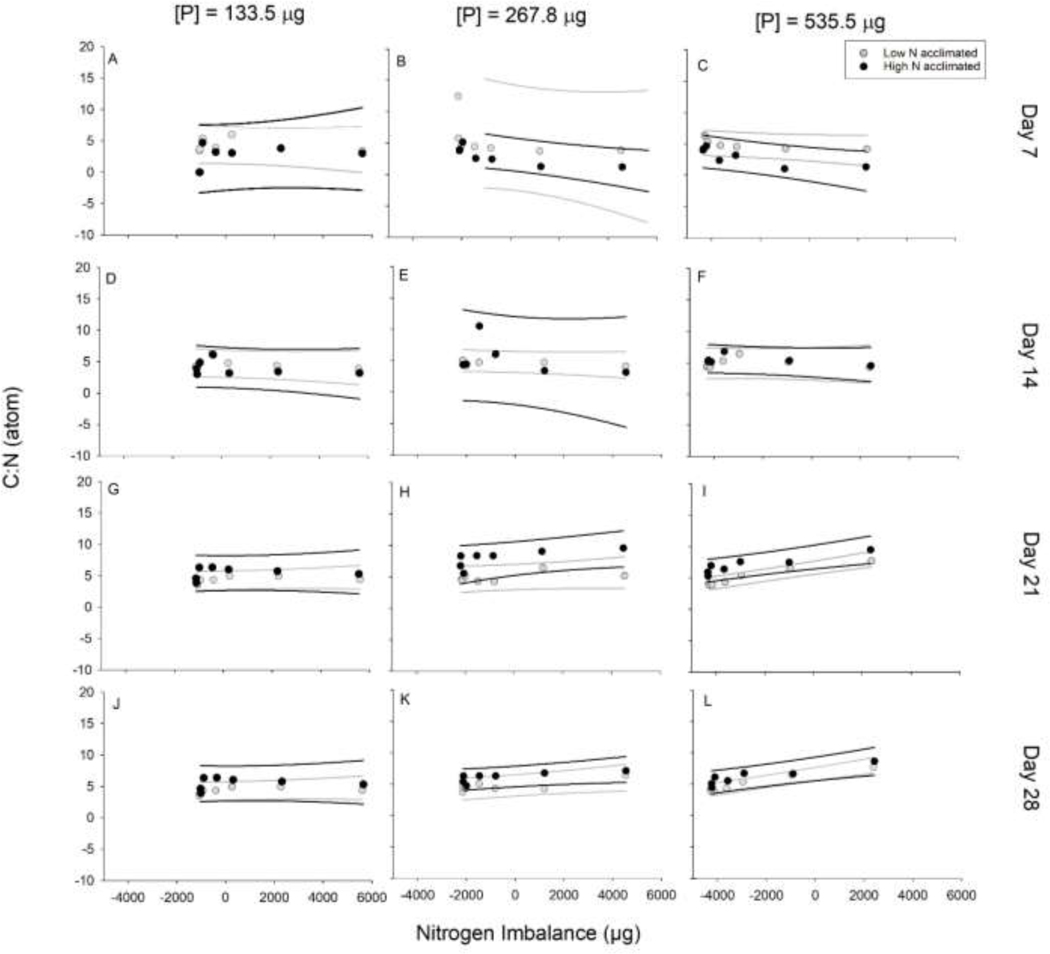
Fig. 3:
The carbon:nitrogen (C:N) by atom for each acclimation treatment over the four sampling events and for each of the phosphorus (P) levels. Lines represent 95% prediction intervals. (A) Day 7 for P of 133.5 μg, (B) Day 7 for P of 267.8 μg, (C) Day 7 for P of 535.5 μg, (D) Day 14 for P of 133.5 μg, (E) Day 14 for P of 267.8 μg, (F) Day 14 for P of 535.5 μg, (G) Day 21 for P of 133.5 μg, (H) Day 21 for P of 267.8 μg, (I) Day 21 for P of 535.5 μg, (J) Day 28 for P of 133.5 μg, (K) Day 28 for P of 267.8 μg, (L) Day 28 for P of 535.5 μg.

