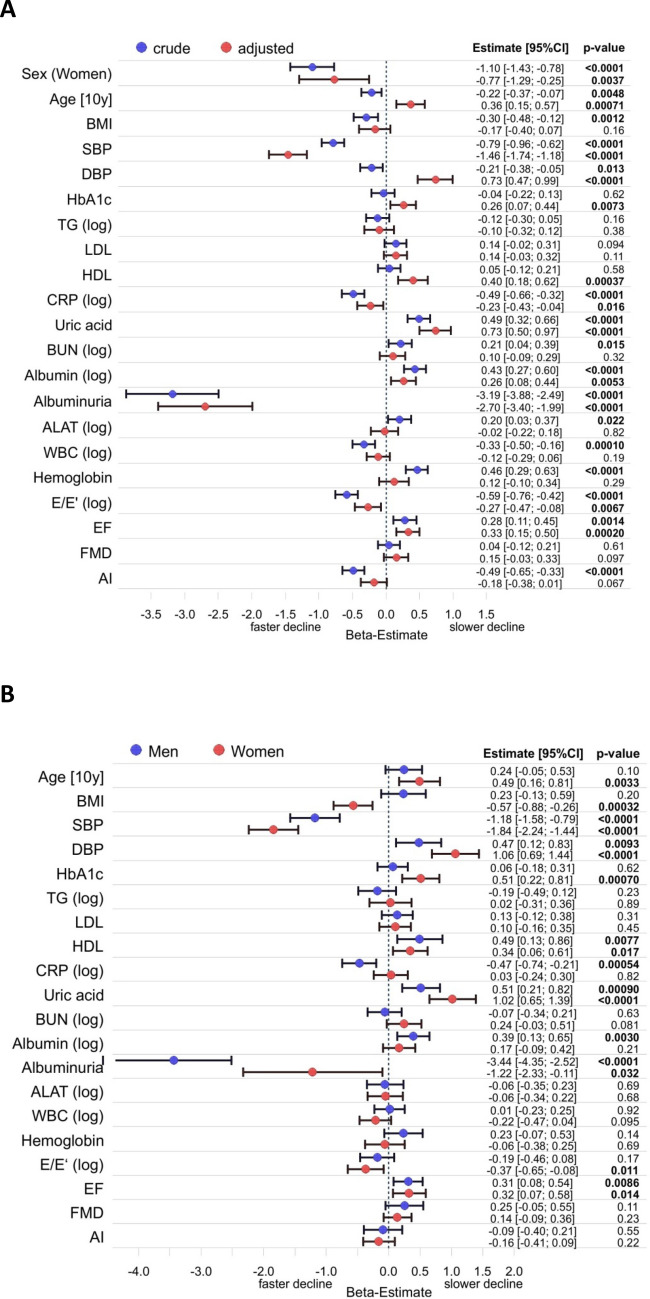
Figure 3.
Forest plot for variables affecting absolute change in eGFR over 5 years. (A) Crude and fully adjusted data for the whole cohort. Linear regression was adjusted for age, sex and all variables listed. (B) Data for men and women adjusted for age and all variables listed. Regression coefficients (beta) for each variable are depicted for males and females with the corresponding p-value. They refer to a 1 SD change in the respective variable with the exception of age, sex and the presence of albuminuria. If data were log-transformed before analysis this is indicated by (log). AI–augmentation index; ALAT–alanine aminotransferase; BMI–body mass index, BUN–blood urea nitrogen; DBP–diastolic blood pressure; EF–ejection fraction; FMD–flow mediated dilatation; HDL–high density lipoprotein cholesterol; LDL–low density lipoprotein cholesterol; SBP–systolic blood pressure; TG–triglycerides; WBC–white blood cells.

