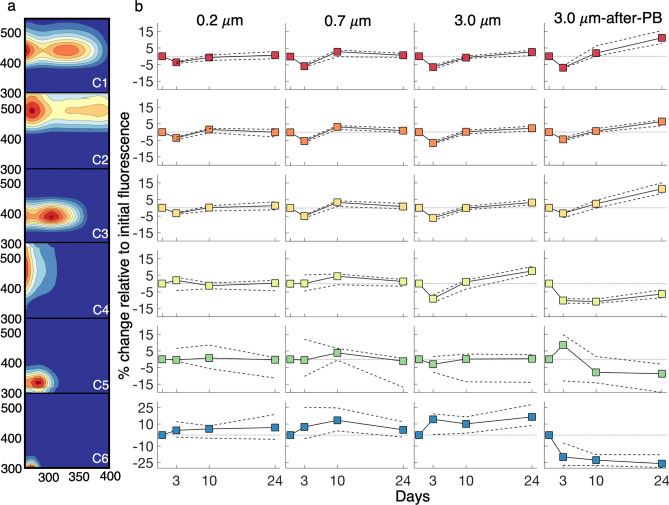
Figure 4.
(a) Component fingerprints for the six component PARAFAC model, corresponding to component change in treatments in the right panel. (b) Median (solid line with colored squares) and interquartile range (dashed lines) for percent change in individual PARAFAC components (relative to initial component loading) for 0.2 μm, 0.7 μm, 3.0 μm and 3.0 μm-after-PB treatments. Percent change is relative to the initial fluorescence maximum for each component, indicating change in that component irrespective of change in other components.

