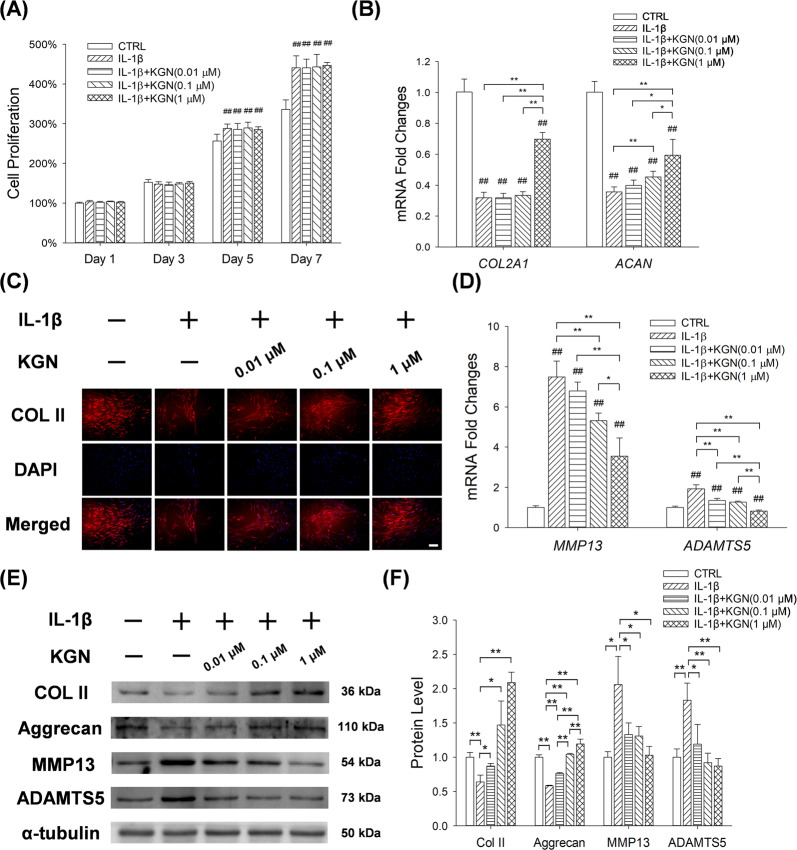
Fig. 2. Effect of KGN on the synthesis of chondrocyte matrix after IL-1β treatment.
A CCK-8 assay for the proliferation of chondrocytes 1, 3, 5 and 7 days after KGN treatment. B RT-PCR analysis for the expression levels of COL2A1 and ACAN mRNA in chondrocytes after KGN treatment. C Immunofluorescence analysis for the expression of COL II proteins in chondrocytes after KGN treatment. (Scale bar = 100 μm). D RT-PCR for the expression levels of MMP13 and ADAMTS5 mRNA in chondrocytes after KGN treatment. E, F Western blot analysis for the expression of COL II, aggrecan, MMP13 and ADAMTS5 proteins in chondrocytes after KGN treatment. Values represent mean ± S.E.M of six replicas for cell proliferation assays, four replicas for RT-PCR experiments and three replicas for Western blot assays, respectively. (*p < 0.05 and **p < 0.01; between the indicated groups and #p < 0.05 or ##p < 0.01 versus the CTRL group).

