Figure 1.
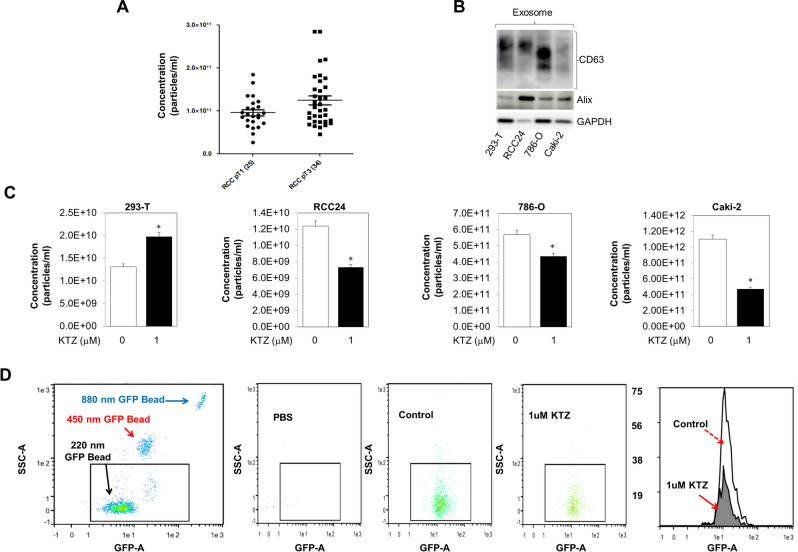
Measurement of exosome secretion by qNano analysis. (A) Total number of EVs in the plasma of patients with Kidney cancer and matched controls were measured by a qNano analysis (n = 59). (B) Expression of exosome CD63, and exosome biogenesis markers Alix in the exosome of 293-T, RCC-24, 786-O, and Caki-2 cells. Exosomes were isolated by UC and filtration (0.45 μm). Full blots are presented in Supplementary Fig. S6 (C) qNano-IZON particle quantitative analysis (NP-100 nanopore) depicting a significant decrease in exosome concentrations (50–200 nm size) in the CM of RCC-24, 786-O, and Caki-2 cells treated with KTZ compared to vehicle treated controls, but not normal kidney HEK 293-T cells. *Denotes significance at p < 0.05 compared to controls and was calculated using GraphPad Prism. (D) Inhibition of exosome secretion using the MACSQuant Analyzer 10 Flow Cytometer and qNano-IZON: The exosome in the conditioned media were isolated and analyzed by the MACSQuant Analyzer 10 Flow Cytometer as described in the “Materials and methods” section. Treatments were at concentrations of 1 μM ketoconazole compounds. Exosome from DMSO treated 786-O-CD63-GFP is used as GFP control and PBS served as a reference control. *Denotes significance at p < 0.05 compared to controls and was calculated using GraphPad Prism. Data for EVs and exosomes was captured using IZON’s Control Suite software version 3.4.2.48. This software can be found at https://support.izon.com/how-can-i-get-the-latest-software-release.

