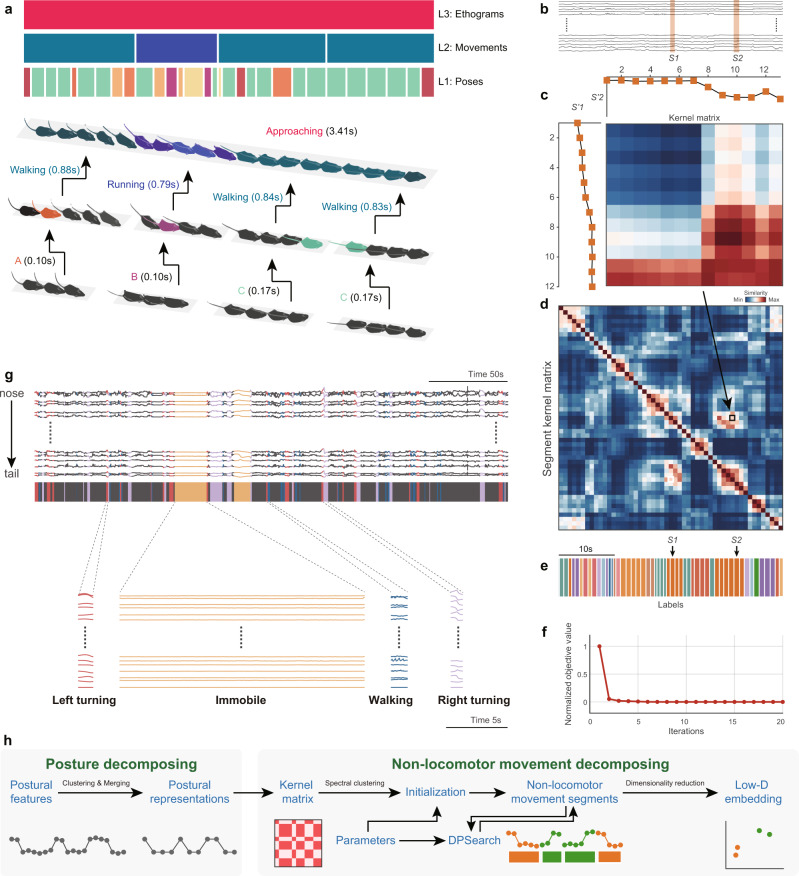
Fig. 3. Dynamic temporal decomposition of multi-scale hierarchical behavior.
a Illustration of the three-layer bottom-up architecture for behavior. Top: The color-coded bars indicate the types of behavior components in the corresponding time period at that layer; each upper layer component is composed of the sequence of the lower layer. The instance of “approaching” is at the ethogram level which is composed of three movement level sequences, and each movement sequence includes a set of postural representations. b Representative animal postural trajectories (black traces) with two selected similar NM segments S1 and S2 (orange bars masked). c Discrete postural sequences S’1 (12 points) and S’2 (13 points) were decomposed from S1 and S2 and used to calculate their similarity kernel matrix K. d Segment kernel matrix T calculated with DTAK. Each pixel on the matrix represents the normalized similarity value of the K for a pair of segments at the ith row and the jth column (e.g., the pixel in the black box indicates the final similarity of S1 and S2). e NM segments decomposed from the postural trajectories shown in b and their color-coded labels. Segments with the same color indicate that they belong to the same types due to their higher similarity. f Optimization process of dynamic temporal decomposition. Objective value (OV) error decreases with each iteration until the termination condition is reached (maximum number of iterations or OV converges). g Top, representative 300-s skeletal traces, where the trace slices highlighted in colors corresponding to the four types of typical NMs (left turn, immobile, walk, right turn). Bottom, magnification of representative traces of these four movement types. h Workflow of the two-stage behavioral decomposition. DPsearch dynamic programming search.

