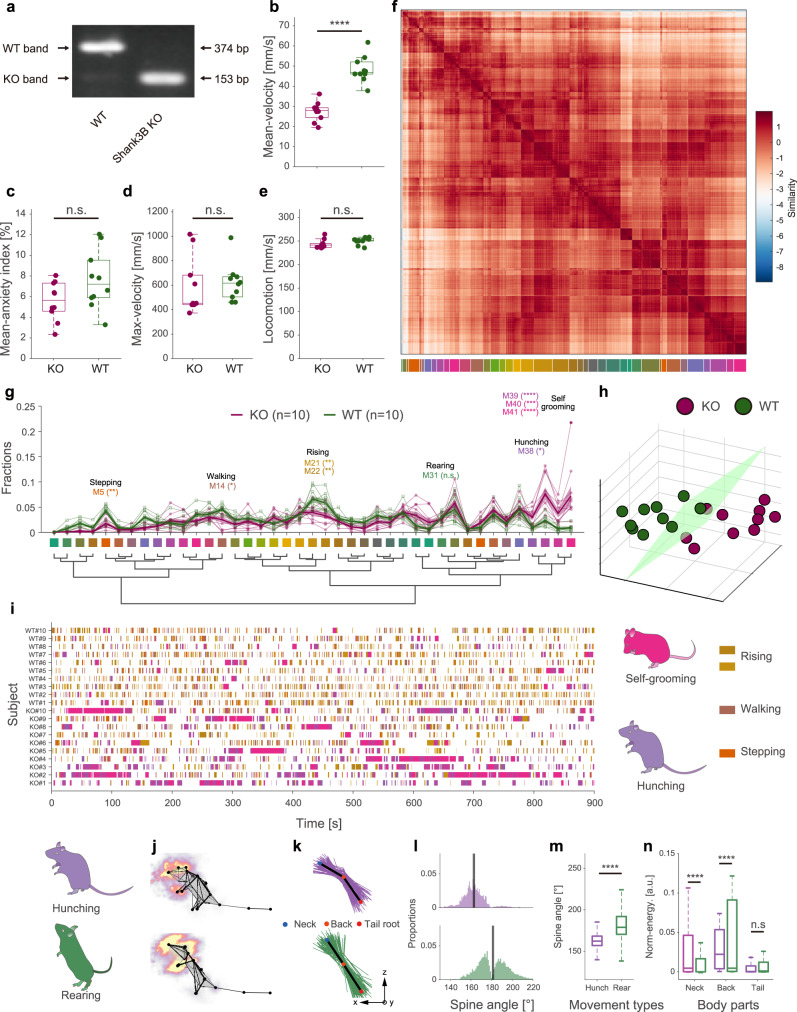
Fig. 6. Spontaneous behavior analysis reveals autistic-like behaviors in Shank3B knockout mice.
a PCR genotyping for Shank3B+/+ (wild type, WT), Shank3B−/− (Shank3B knockout, KO) mice. The full scans of all the sample can be found in Supplementary Fig. 9. b–e Box plots of mean velocity, mean anxiety index, maximum velocity, and locomotion of the two groups of animals (purple: KO, n = 10, green: WT, n = 10; statistics: two-sided Mann–Whitney test for maximum velocity; two-sided unpaired T-test for others, ****P = 9.0549 × 10⁻⁸, t = 8171, DF = 18), values are represented as mean ± SD. f Top: recalculated paired-wise similarity matrix. The movement bouts of all 20 mice involved were grouped (n = 16607) and rearranged in a dendrogram (g). Each pixel on the matrix represents the normalized similarity value of a pair of movement bouts at the ith row and the jth column. The color-coded bars (41 clusters) indicate the movements being clustered (bottom). g Comparison of the fraction of movement types between KO mice and WT mice. The bold traces and shadows indicate the mean ± s.e.m. Fractions of each group and light color traces are the fractions of all 20 mice (purple, KO, n = 10; green, WT, n = 10). Middle color-coded labels and dendrogram indicate the movement types. Eight movements have significant differences between the two groups, and the fractions of the four movements that KO mice prefer are hunching (M38, KO = 3.00 ± 0.56%, WT = 0.94 ± 0.15%) and self-grooming groups (M39, K = 7.65 ± 1.21%, W = 2.34 ± 0.33%; M40, K = 3.73 ± 0.72%, W = 0.75 ± 0.19%; M41, K = 7.23 ± 1.88%, W = 0.90 ± 0.18%). Statistics: two-way ANOVA followed by Holm–Sidak post hoc multiple comparisons test, **M5, P = 0.0065; *M14, P = 0.0392; **M21, P = 0.0012; **M22, P = 0.0030; *M38, P = 0.0456; ****M39, P < 0.0001; ***M40, P = 0.0001; ****M41, P < 0.0001. h Low-dimensional representation of the two animal groups (purple, KO, n = 10; green, WT, n = 10). The 20 dots in 3D space were dimensionally reduced from 41-dimensional movement fractions, and they are well separated. i Ethograms of the eight significant movements. j–n Kinematic comparison of rearing and hunching (upper row refers to hunching; lower row refers to rearing). j Average skeletons of all frames and normalized moving intensity (side view) of rearing and hunching. k Spine lines (the lines connecting the neck, back, and tail root) extracted from all frames (rearing, 16,834 frames; hunching, 10,037 frames) in movement types. For visualization purposes, only 1% of spine lines are shown in the figure (rearing, 168/16,834; hunching, 100/10,037). Black lines refer to the averaged spine line of the hunching and rearing phenotypes; l histograms of the spine angles (angle between three body parts). During rearing, the spine angles of the animals swing, and the average spine angle is straight (181.34 ± 15.63°). By contrast, the spine angles of the rodents during hunching are consistently arcuate (162.88 ± 10.08°). m, n Box plot of spine angles of the two movement types. n Box plot of normalized MI of the three body parts involved. Statistics for m, n: two-sided Mann–Whitney test. ****P < 0.0001. In box plots, the lower and upper edges of the box are the 25th and 75th percentiles of the values, the central marks indicate the median, and the lower and upper whiskers are the minima and maxima values. Source data are provided as a Source Data file.

