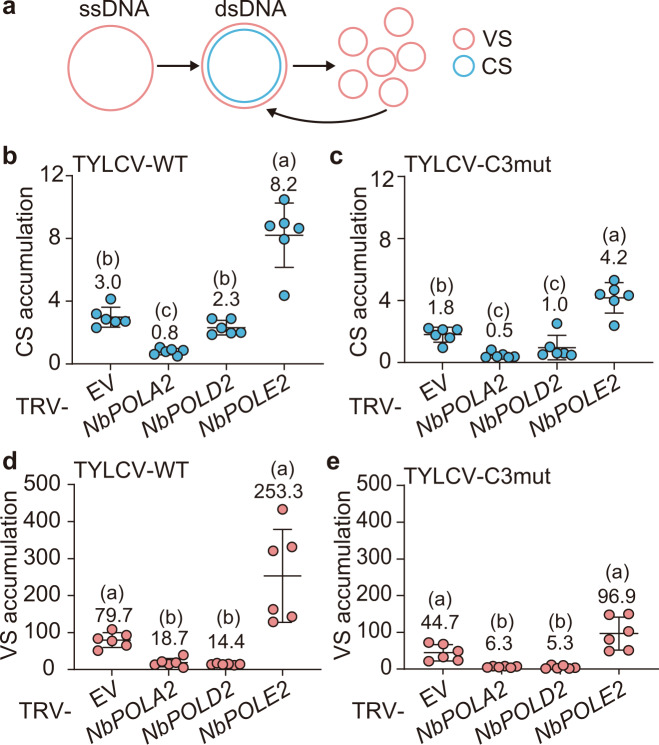
Fig. 3. Effect of silencing POLA2, POLD2, or POLE2 on the accumulation of viral and complementary DNA strands.
a Schematic representation of the viral DNA forms during the infection. VS: viral strand; CS: complementary strand; ssDNA: single-stranded DNA; dsDNA: double-stranded DNA. b, c, d, e Accumulation of complementary strand (CS) (b, c) and viral strand (VS) (d, e) during local TYLCV infections in POLA2-silenced (TRV-NbPOLA2), POLD2-silenced (TRV-NbPOLD2), POLE2-silenced (TRV-NbPOLE2), or empty vector control (EV) N. benthamiana plants, measured by qPCR at 3 days post inoculation. Data are the mean of six independent biological replicates; error bars represent SD. The 25S ribosomal DNA interspacer (ITS) was used as a reference gene; values are presented relative to ITS. TYLCV-WT: wild-type TYLCV; TYLCV-C3mut: C3 null TYLCV mutant. Mean values are shown. Letters indicate a statistically significant difference according to one-way ANOVA-Welch (in b: degrees of freedom df = 3, F value = 50.98; in d: degrees of freedom df = 3, F value = 18.42; in e: degrees of freedom df = 3, F value = 17.70) followed by Games–Howell’s multiple comparison test (P < 0.05), or according to one-way ANOVA (in c: degrees of freedom df = 3, F value = 32.27) followed by Tukey’s multiple comparison test (P < 0.05). The original data from all experiments and replicates can be found in the Source data file.

