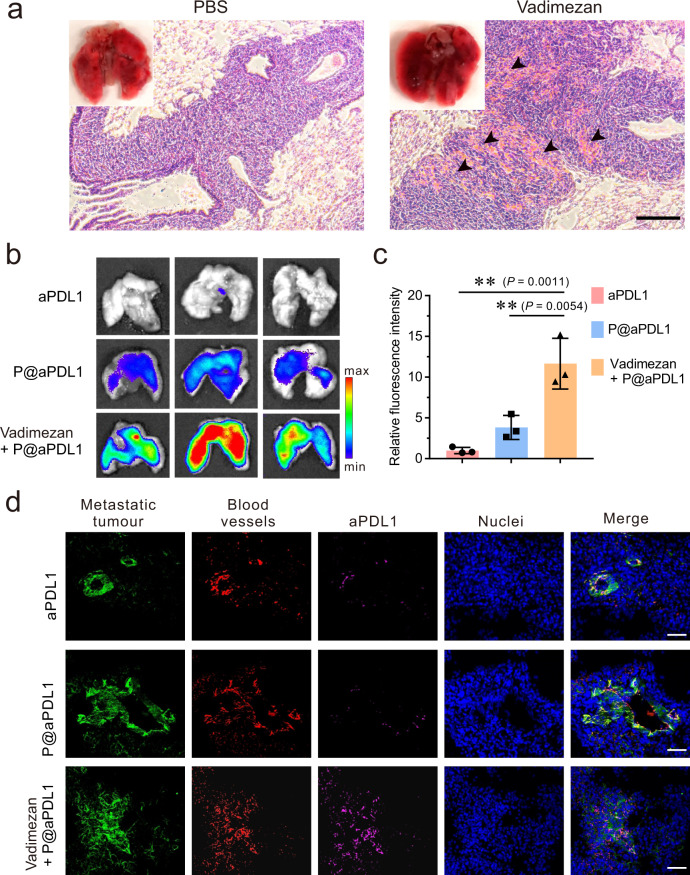
Fig. 2. P@aPDL1 recruitment at the tumour site after Vadimezan treatment.
a Photographs and H&E staining images of the 4T1 tumour metastasis in the lung post-treatment with PBS and Vadimezan. Black arrows marked the haemorrhaging sites within the tumour, scale bar: 100 µm. b Fluorescence images showing the accumulation of aPDL1-Cy5.5 in the tumour metastases within the lung. c Quantitative analysis of the fluorescence intensity of aPDL1 in the lungs, n = 3 biologically independent animals, data are prestented as mean ± SD. d Confocal images showing the aPDL1 distribution within metastases in the lung. Metastatic tumour cells expressed GFP (green), blood vessels were marked by AF568-anti-CD31 antibody (red), and the aPDL1 was marked by Cy5-conjugated anti-rat IgG antibody (magenta), nuclei were labelled by Hoechst 33342 (blue), scale bar: 50 µm. Data are presented as mean ± SD, statistical significance was analysed via ANOVA (one-way, Tukey post-hoc test). P-value: ** P < 0.01.

