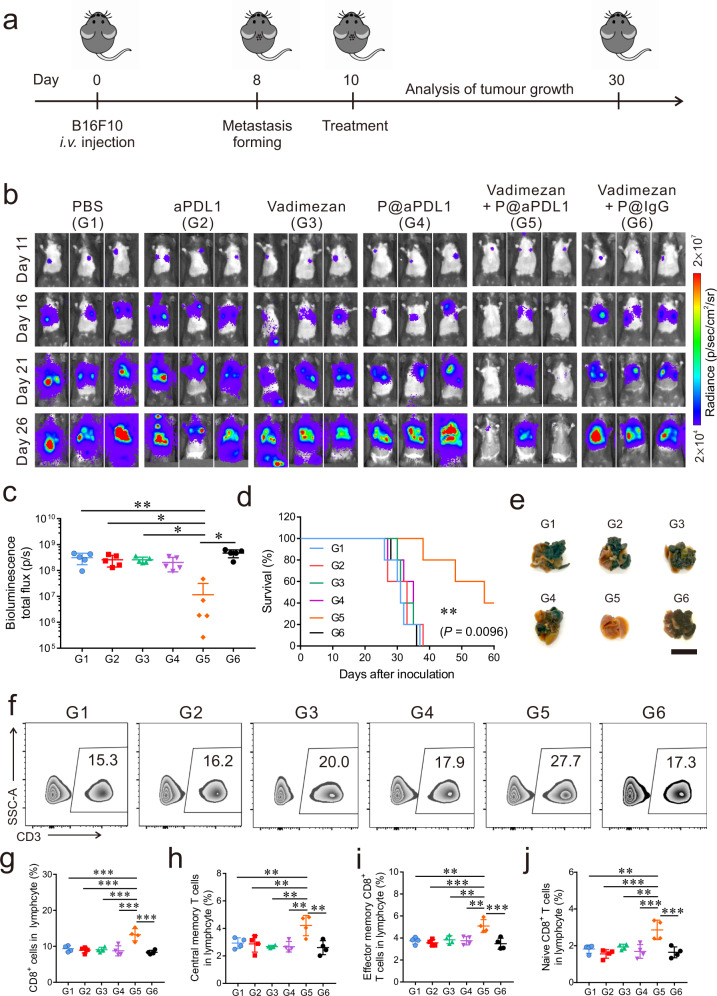
Fig. 5. P@aPDL1 combined with Vadimezan promotes anti-tumour effects in the B16 tumour model.
a Schematics of the melanoma metastatic model and treatment. Mice were treated 10 days post-tumour cells inoculation. b In vivo tumour bioluminescence images of mice receiving different treatments. c Quantitative analysis of the tumour bioluminescence intensity at day 26, n = 5 biologically independent animals. d Survival rate of the mice in different groups, n = 5 biologically independent animals. e Representative lung photographs after treatment, scale bar: 1 cm. f Representative flow cytometry analysis of CD3+ T cells in the PB. The relative quantification of the g CD8+ T cells, h central memory CD8+ T cells (CD8+CD62L+CD44+), i effector memory CD8 T cells (CD8+CD62L−CD44+) and j naive CD8 T cells (CD8+CD62L+CD44−) in the blood 14 days after treatment, n = 4 biologically independent animals. G1, PBS; G2, aPDL1; G3, Vadimezan; G4, P@aPDL1; G5, P@aPDL1 + Vadimezan; G6, P@IgG + Vadimezan. All the data are presented as mean ± SD, the statistical significance of the survival was calculated via log-rank (Mantel–Cox) test, and others were calculated via one-way ANOVA with a Tukey post-hoc test. P-value: *P < 0.05, **P < 0.01, ***P < 0.001. c G1 vs. G5: P = 0.0017, G2 vs. G5: P = 0.0101, G3 vs. G5: P = 0.0108, G4 vs. G5: P = 0.0572, G6 vs. G5: P < 0.0001. g G1 vs. G5: P = 0.0004, G2 vs. G5: P < 0.0001, G3 vs. G5: P = 0.0002, G4 vs. G5: P < 0.0001, G6 vs. G5: P < 0.0001. h G1 vs. G5: P = 0.0076, G2 vs. G5: P = 0.0055, G3 vs. G5: P = 0.0016, G4 vs. G5: P = 0.0016, G6 vs. G5: P = 0.001. i G1 vs. G5: P = 0.0014, G2 vs. G5: P = 0.0004, G3 vs. G5: P = 0.0025, G4 vs. G5: P = 0.0014, G6 vs. G5: P = 0.0002. j G1 vs. G5: P = 0.0012, G2 vs. G5: P < 0.0001, G3 vs. G5: P = 0.0034, G4 vs. G5: P = 0.0004, G6 vs. G5: P = 0.0002.

