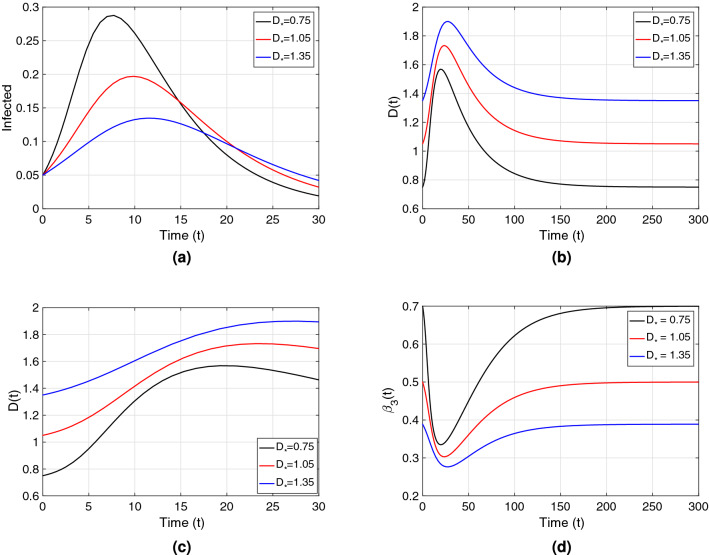
Figure 6.
(a) Point prevalence, I(t)/N, from the system in Eq. (1) with respect to time. (b) Distance D(t) kept by individuals through the epidemic. (c) Zoomed version of (b). (d) Transmission rate from Eq. (8). All plots in the figure consider as the transmission rate. Black, red and blue curves correspond to , , and respectively. These correspond to societies of small ([0, 100)), medium ([100, 120]) and large () natural-distance types respectively (see Table 1). The other parameter values were taken to be ; , , , . The value for each society type is: (black), (red), (blue). The initial condition was used for each type of society.

