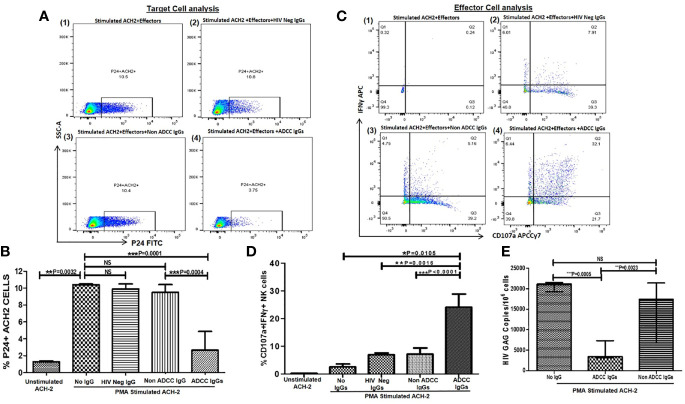
Figure 1.
ADCC activity against reactivated ACH-2 cells. (A) The representative dot plots show % p24+ACH-2+ cells (X axis) in (1) PMA stimulated ACH2 with PBMCs (as a source of effector: Nk cells) without antibody (2), after addition of HIV Neg IgGs or (3) non-ADCC IgGs or (4) ADCC IgGs. (B) The bar diagram shows frequency of the p24+ACH2 cells (Y axis) in unstimulated ACH-2 control, after PMA stimulation, after addition of HIV Neg IgGs (n = 5), non-ADCC IgGs (n = 11), and ADCC IgGs (n = 14)(X axis). (C) The representative dot plots show NK cells (effectors from PBMC of HIV negative healthy individual) expressing IFNγ (on Y axis) and CD107a expression (on X axis) in (1) PMA stimulated ACH2 with PBMCs without antibodies (2), after addition of HIV Neg IgGs or (3) non-ADCC IgGs or (4) ADCC IgGs. (D) The bar graph shows frequencies of CD107a and INFγ secreting NK cells (on Y axis) in unstimulated ACH-2, after PMA stimulation, after addition of HIV Neg IgGs, non-ADCC IgGs or ADCC IgGs (on X axis). (E) The bar diagram shows HIV gag DNA copies per million cells in ACH-2 cells (on Y axis) after PMA stimulation, after addition of ADCC IgGs and non-ADCC IgGs (on X axis). NS, not significant.

