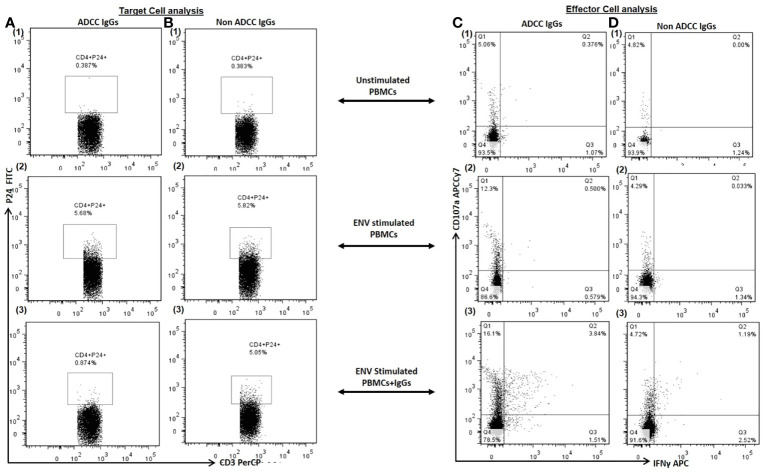
Figure 2.
Target Cell Analysis. The representative dot plots show frequency of p24+CD4+ cells (P24 on Y axis and CD3 on X axis) in (1) unstimulated PBMCs (as a source of both target: primary CD4+ T cells and effector: Nk cells) (2), Env stimulated PBMCs and (3) after addition of autologous ADCC IgGs in Env simulated PBMCs (Column A) and after addition of autologous non ADCC IgGs (Column B). Effector Cell Analysis. The representative dot plots show CD107a (on Y axis) and IFNγ (on X axis) secreting NK cells in (1) unstimulated PBMCs (2), Env stimulated PBMCs and (3) after addition of autologous ADCC IgGs in Env simulated PBMCs (Column C) and after addition of autologous non ADCC IgGs (Column D).

