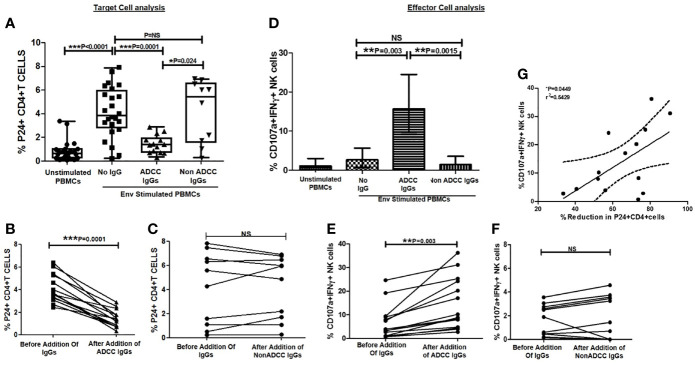
Figure 3.
Ability of ADCC antibodies to lyse reactivated HIV-infected CD4+ T cells. (A) Scatter plot shows the frequencies of p24+CD4+ cells (on Y axis) before HIV ENV stimulation, after stimulation with HIV-1 C Env peptide pool and after addition of ADCC IgGs or non-ADCC IgGs(on X axis). The graph (B) shows frequencies of p24+CD4+ cells (on Y axis) before and after addition of ADCC IgGs (on X axis) in 14 paired samples (P = <0.0001). The graph (C) shows frequencies of p24+CD4+ cells (on Y axis) before and after addition of non-ADCC IgGs (on X axis) in 10 paired samples. (Wilcoxon Matched paired test) (D) The bar diagram shows CD107a and IFNγ secreting NK cells (on Y axis) before HIV ENV stimulation, after stimulation with HIV-1 C Env peptide pool, and after addition of ADCC IgGs and non-ADCC IgGs (on X axis). The graph (E) shows percent CD107a+IFNγ+ NK cells (on Y axis) before and after addition of ADCC IgGs (P = 0.003) and (F) non-ADCC IgGs in 14 and 10 paired samples respectively (Wilcoxon Matched paired test). (G) The scatter dot plot represents the positive association between the % reduction in p24+CD4+ cells (on X axis) with frequency of CD107a and IFNγ secreting NK cells (on Y axis) in ADCC responders. (Spearman correlation analysis, P < 0.05). NS, not significant.

