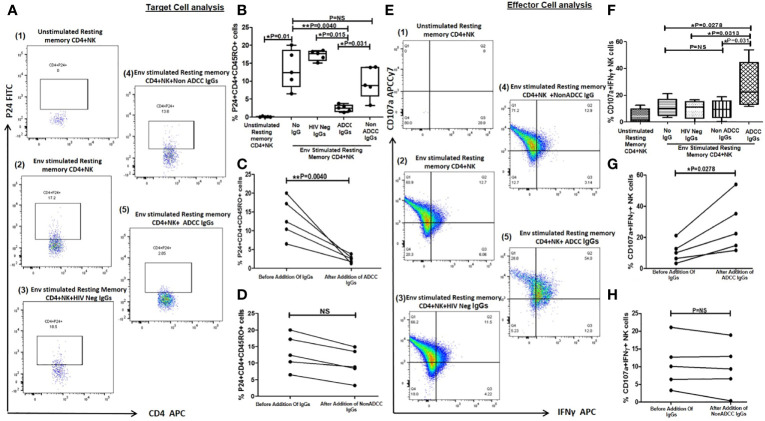
Figure 4.
Lysis of reactivated resting memory CD4+ cells from HIV infected patients by ADCC. (A) The Representative FACS dot plots shows % P24+CD45RO+CD4+ cells (resting memory CD4) (P24 on Y axis and CD4 on X axis) in (1) unstimulated resting memory CD4 cells with effector cells (NK cells) (2), after HIV ENV C stimulation (3), after addition of HIV Neg IgGs (4), after addition of NonADCC IgGs, and (5) after addition of ADCC IgGs. (B) The bar diagram shows the frequency of p24+CD45RO+CD4+ cells (on Y axis) before HIV ENV C stimulation, after HIV ENV C stimulation, after addition of HIV neg IgGs, ADCC IgGs and non-ADCCC IgGs (on X axis). The paired line graph shows % p24+CD4+CD45RO+ cells (on Y axis) before and after addition of (C) ADCC IgGs (P = 0.004), and (D) before and after addition of non-ADCC IgGs. The data was analyzed with Wilcoxon matched paired T test. (E). The representative dot plots shows CD107a (on Y axis) and INFγ (on X axis) secreting cells in (1) unstimulated resting memory CD4 cells with effector cells (NK cells) (2), after stimulation with Env C (3), after addition of HIV neg IgGs (4), after addition of non ADCC IgGs, and (5) after addition of ADCC IgGs. (F) The bar diagram shows percent CD107a and IFNγ secreting NK cells (on Y axis) before HIV ENV C stimulation, after ENV stimulation, after addition HIV neg IgGs, non-ADCC IgGs, and ADCC IgGs (on X axis). The paired graphs (G) shows frequencies of CD107a+IFNγ+ NK cells (on Y axis) before and after addition of ADCC Abs (P = 0.0278) (Wilcoxon matched paired T test) and (H) before and after addition of non-ADCC IgGs. NS, not significant.

