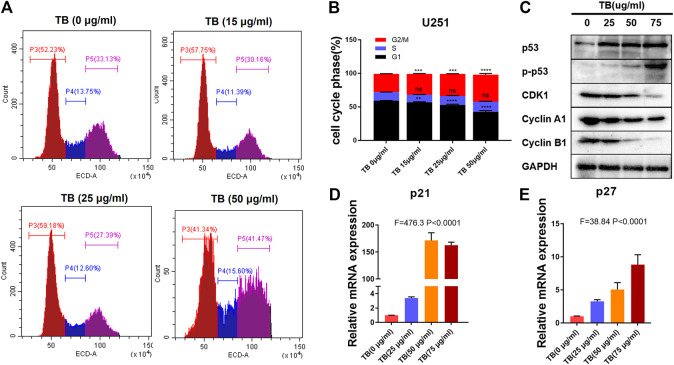
FIGURE 8.
(A): Effect of TB on the cell cycle of U251 cells determined by flow cytometry. (B): Quantitative analysis of cell cycle arrest induced by TB in U251 cells. (C): Relative protein expression of target genes in U251 cells with 48 h TB treatment at 25, 50, and 75 μg/ml. (D, E): Relative mRNA expression of p21 and p27 in U251 cells with 48 h TB treatment at 25, 50, and 75 μg/ml. Values are presented as mean ± SD of three replicates.

