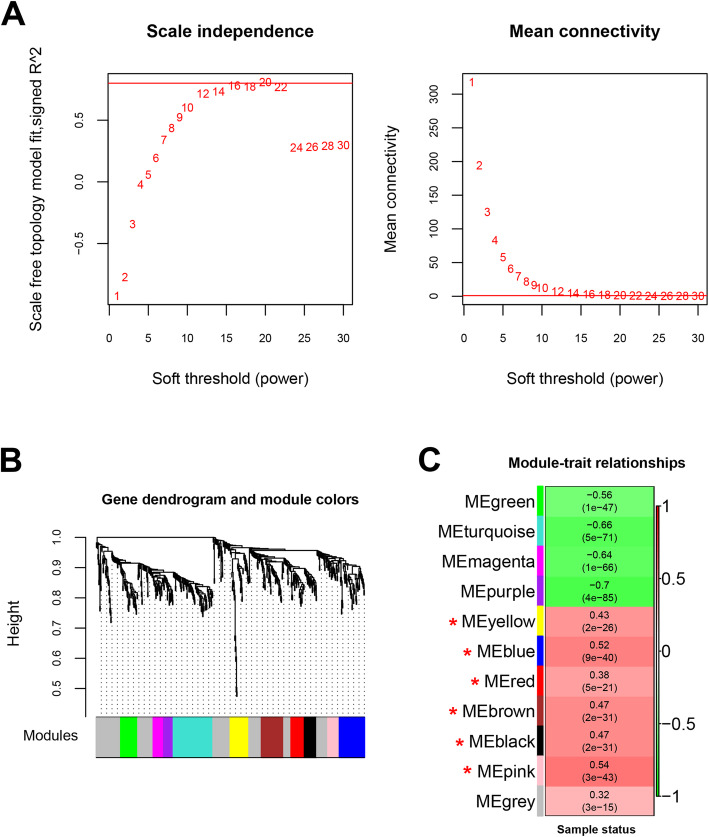
Fig. 4.
The construction of WGCNA modules in dataset GSE36791. a the correlation coefficient square (r2) of eigengenes (red line) under soft threshold power (red number). b the mean connectivity of eigengenes (red line) under soft threshold power (red number). c WGCNA modules in the gene dendrogram based on the criteria of number of genes > 100, cut Height = 0.995, soft threshold power 20 and r2 = 0.8. D, the heatmap showing the correlation of WGCNA modules with SAH clinical traits. Green and red color note negative and positive correlation, respectively. Red stars note 6 modules showed higher, closer correlation (correlation p value ≤0.05 and coefficient > 0.32) than gray module

