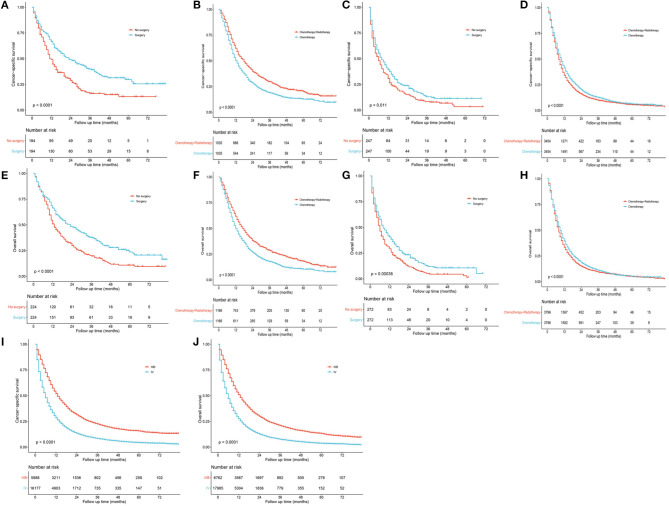
Figure 7.
Survival curves after propensity score matching. (A,E) Surgery vs. no surgery for IIIB patients. (B,F) Chemotherapy vs. chemotherapy plus radiotherapy for IIIB patients. (C,G) Surgery vs. no surgery for IV patients. (D,H) Chemotherapy vs. chemotherapy plus radiotherapy for IV patients. (I,J) Stage IIIB vs. IV.

