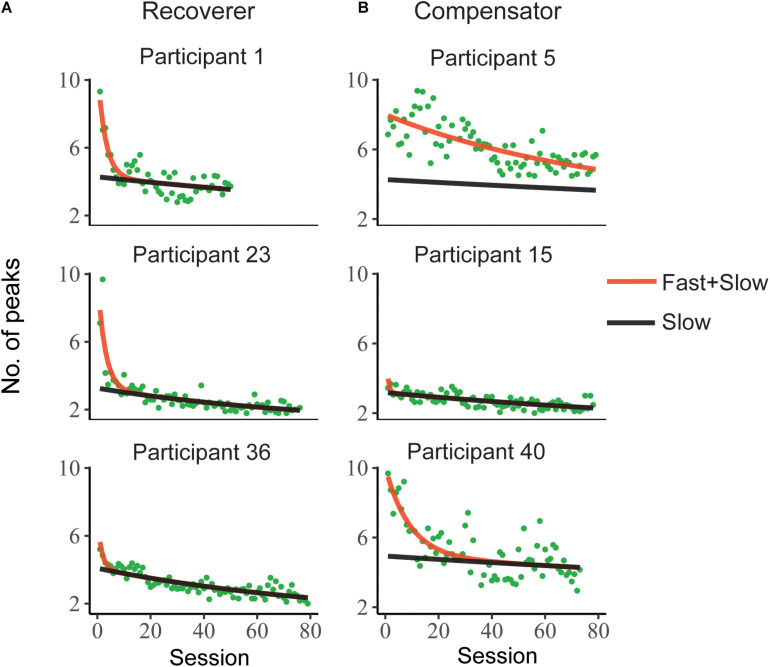
FIGURE 3.
Representative evolution of the mean number of velocity peaks per trial during test sessions during training for six stroke participants. The red line represents the summed effects of fast and slow components in a double exponential mixed effect model. The black line represents the effect of the slow component for each individual. Note that the distinction between (A) Recoverers and (B) Compensators was made based on the analysis of changes in joint correlations (see text).

