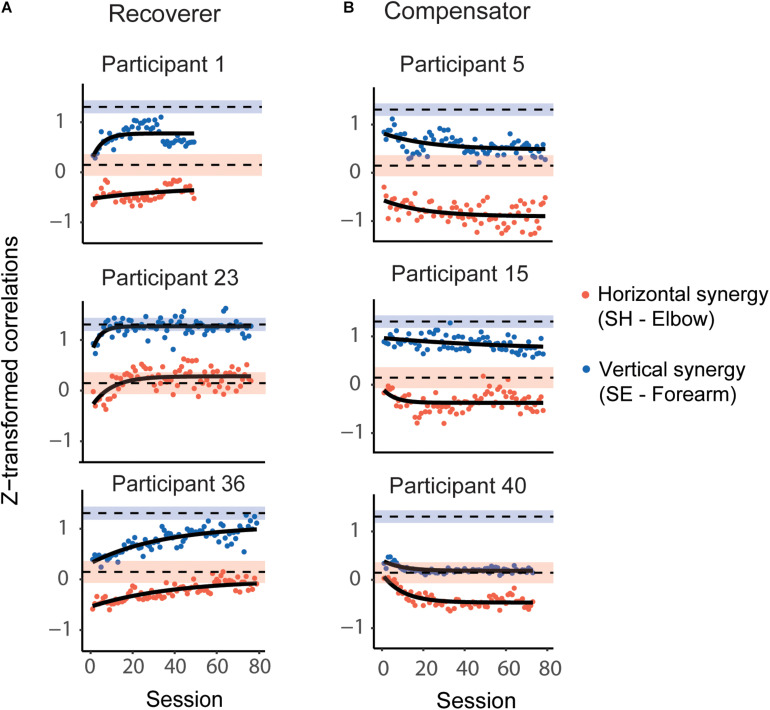
FIGURE 5.
Representative evolution of the horizontal and vertical synergies, as defined by correlations in joint velocities, during Ladybug tests during 4 weeks of training; same post-stroke participants as in Figure 3. (A) Recoverers improved for both correlations, which were closer to the respective mean correlations in the control participants toward the end of training compared to the beginning of training. (B) Compensators deviated further from the respective correlation values for control participants for at least one of the correlations. The red dots represent the z-transformed SH-Elbow joint correlation; the blue dots represent the z-transformed SE-Forearm joint correlations. The black curves represent model fits. The blue shaded and red shaded areas represent the 99% CI range for the z-transformed SE-Forearm and SH-Elbow correlations, respectively, for control participants. The dashed black lines represent the mean values for the correlations for control participants.

