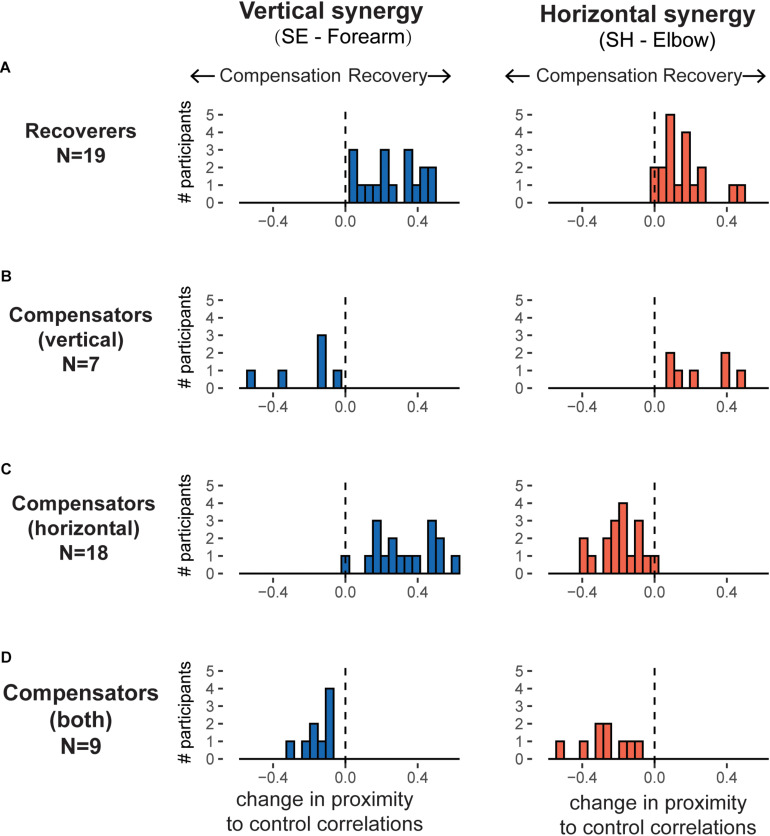
FIGURE 6.
Histograms of evolution of the horizontal and vertical synergies, as defined by correlations in joint velocities, over training for the recovers and the three sub-clusters of compensators. For each panel, the horizontal axis represents the changes in correlation over training, with positive values indicating participants moving closer to control group synergies (recovery) and negative values indicating moving further away from control group synergies (compensation). The different patterns of change for the horizontal synergies (right panels) and for the vertical synergies (left panels) results in four possible clusters. (A) Recoverers (N = 19): improved in both synergies. (B) Vertical compensators (N = 7): improved in horizontal synergy but worsened in vertical synergy. (C) Horizontal compensators (N = 18): improved in vertical synergy but worsened in horizontal synergy. (D) Worsened in both synergies (N = 9).

