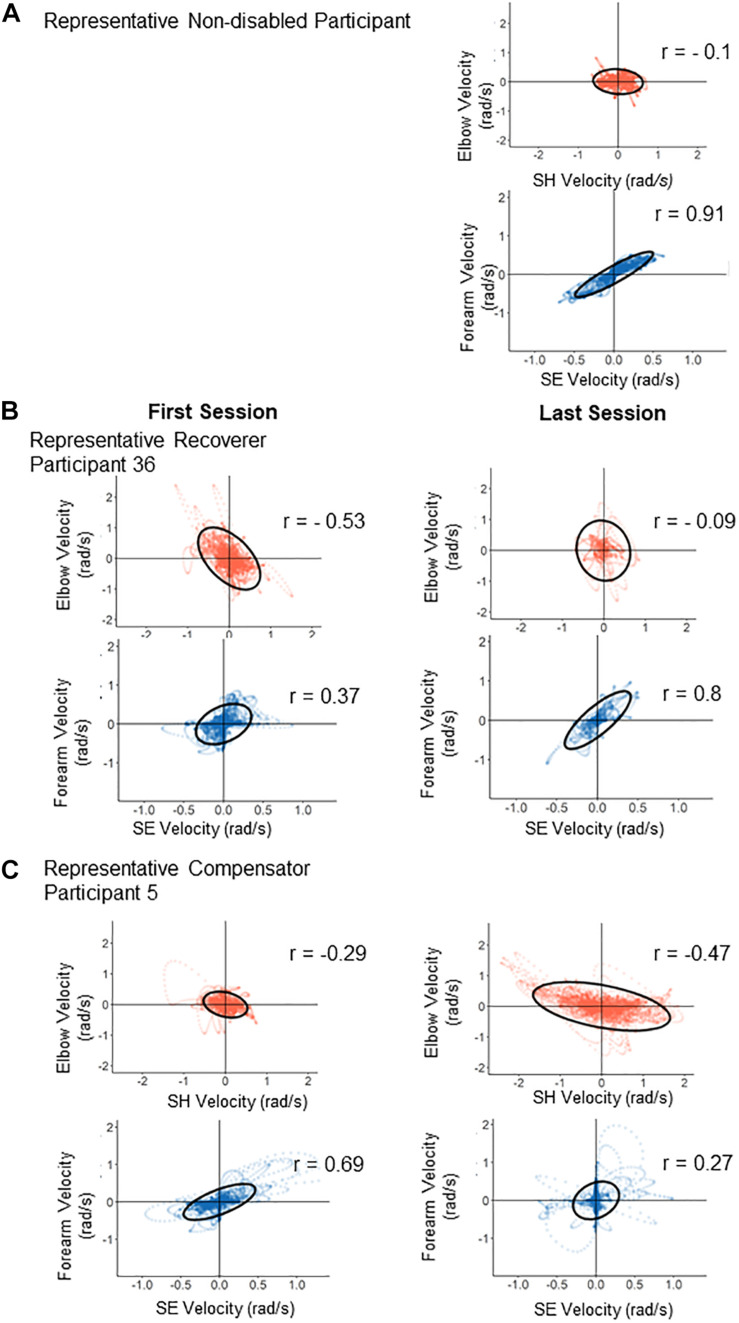
FIGURE 7.
Illustration of changes in correlations from the first test (left panels) to the last test (right panels) for two representative participants. Each panel is a scatter plot of the velocities contributing to each synergy (red, horizontal synergy; blue, vertical synergy). (A) Typical control joint velocities from a control participant at the end of training: only the velocities contributing to the vertical synergy are strongly correlated. (B) The horizontal and vertical synergies of the Recoverer became close to those of the control participant pattern after training. (C) The horizontal and vertical synergies of the Compensator deviated further away from those of the control participant after training.

