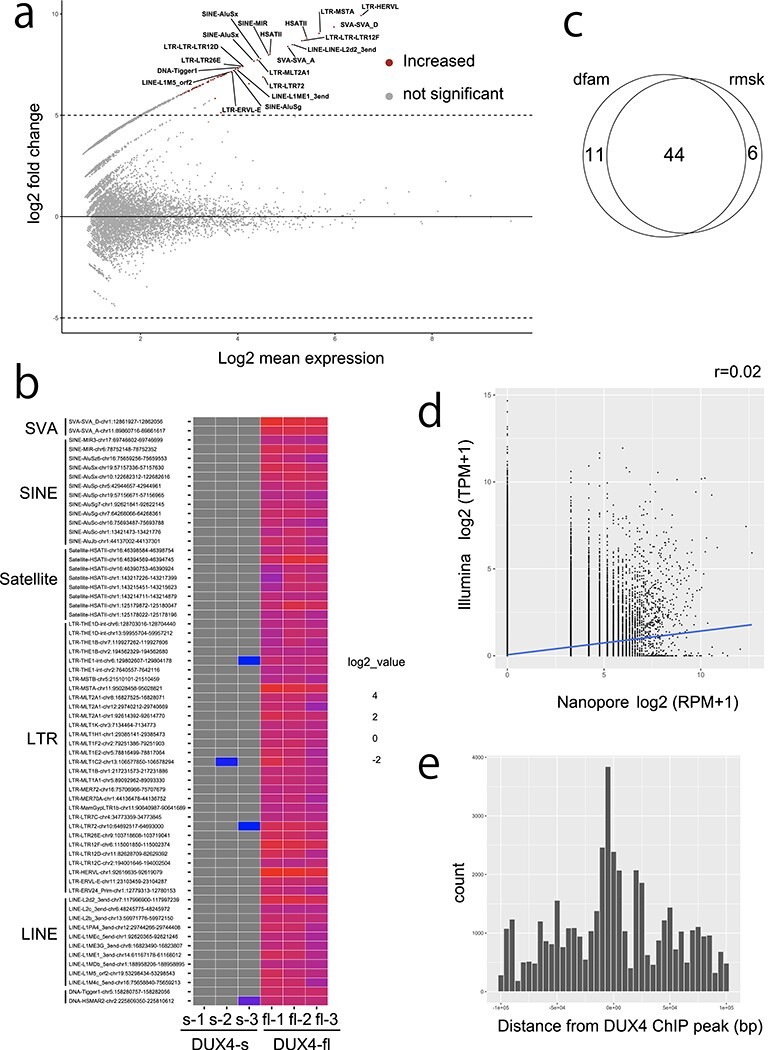
Figure 2.

(a) MAplot for differentially expressed repeats (DERs) from Dfam repeats in triplicated dRNA-seq data from DUX4-fl and DUX4-s overexpressing RD cells. Only the top 20 repeats are shown. Transcripts from repetitive elements with adjusted P-value <0.001 and log2fold change ≥5 were determined as differentially expressed repeats. (b) Heatmap of DERs. Many of the upregulated DERs are ERV–MaLR, which confirms previous reports (14). (c) Venn diagram shows 44 repeats overlap in the Dfam and Repbase annotations. (d) Correlation is not observed (r = 0.02) between nanopore and Illumina read counts in Dfam repeats. Pearson correlation coefficients are shown. (e) DERs were located near the DUX4–ChIP peaks as previously reported (10).
