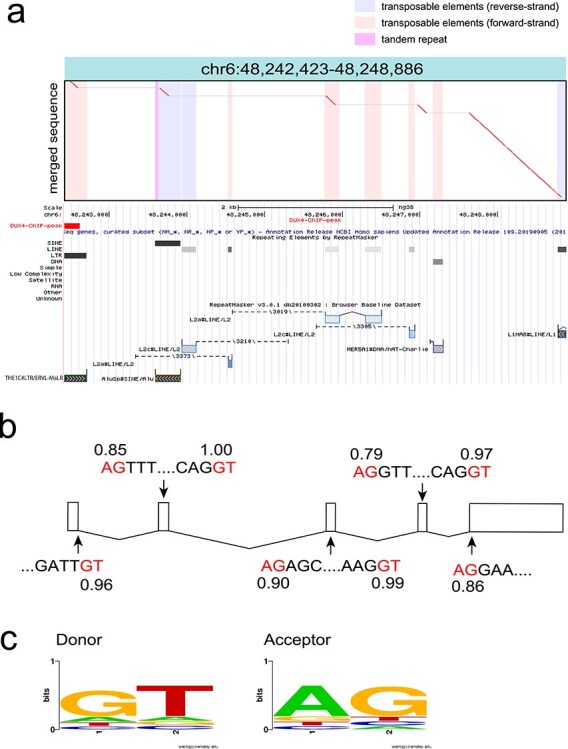
Figure 4.

(a) An example dotplot of spliced repeat transcript. All detected transcripts from fl-1, fl-2 and fl-3 were merged using lamassemble, and then aligned to the reference genome. This transcript was transcribed from an ERVL–MaLR, and then four splicing events occurred. Merged sequence is on the vertical axis and reference genome is on the horizontal axis in the dotplot. Vertical colored striped represent repeats in the reference genome. Below the dotplot, RepeatMasker with Repbase annotation is shown from the UCSC genome browser. (b) Splicing occurred at canonical splice donor and acceptor signals (red letters). Splice site prediction was done using NNSPLICE (v.9.0) (https://www.fruitfly.org/seq_tools/splice.html). The splice donor and acceptor prediction scores are shown. All splicing sites were predicted from LAST alignment. (c) Donor and acceptor sequences are shown as a sequence logo. Sequence logo was created by WebLogo (https://weblogo.berkeley.edu/logo.cgi).
