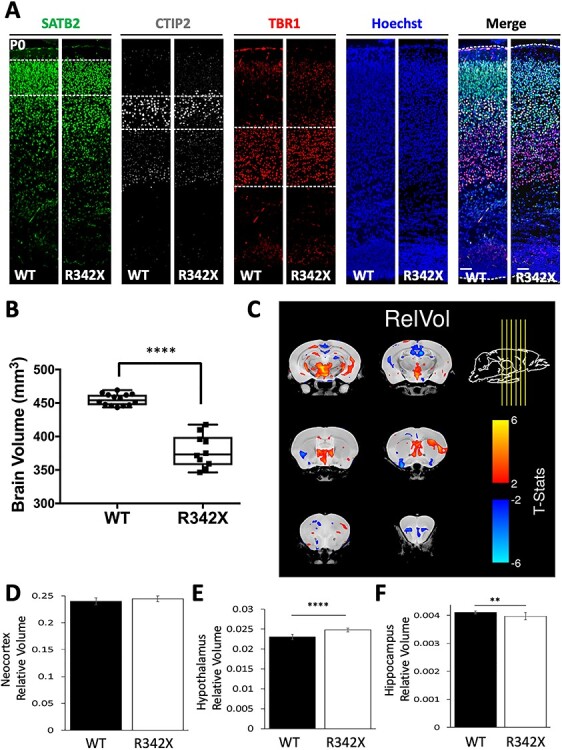
Figure 4 .

Analysis of corticogenesis and brain volume differences in R342X mice. (A) P0 sections from WT and R342X mice stained for layers II–IV (SATB2, green), layer V (CTIP2) and layer VI (TBR1) neuronal markers demonstrate no differences in cortical lamination. Cell counts are presented in Supplementary Material, Fig. S4. Hoechst served as a nuclear counterstain. (B) Plot of absolute brain volume differences obtained by MRI between WT and R342X animals (P100). (C) Coronal images from six different rostral–caudal locations (indicated by yellow arrows) showing the relative changes in brain volume identified in R342X mice compared with control animals. (D) The neocortex showed no difference in relative volume while statistically significant differences were observed in the hypothalamic (E) and hippocampal (F) brain regions. **, P < 0.01; ****, P < 0.0001.
