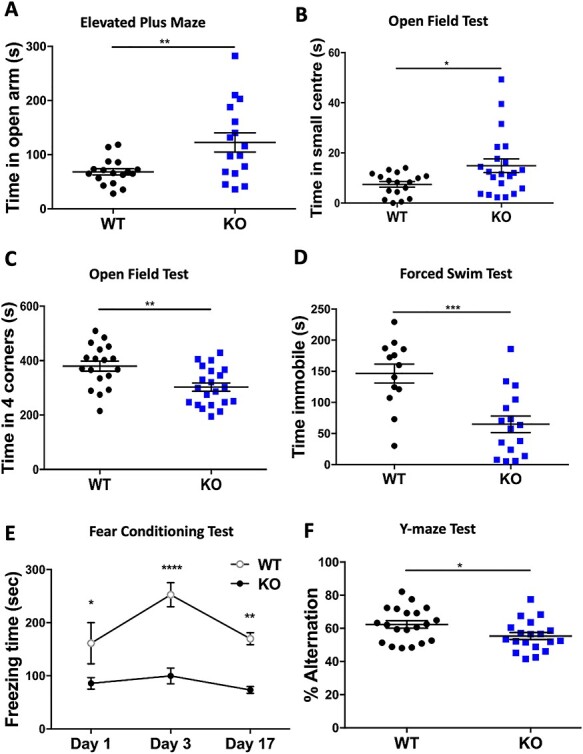
Figure 5 .

Behavioral testing of R342X mice. Cohorts of P60 control (WT, black dots) and R342X mice (KO, blue dots) were subjected to a battery of behavior tests. (A) Time spent in the open arms of the EPM. (B) OF test plot of time spent in the small center. (C) OF test plot of time spent in the four corners. (D) FST plot of the time spent immobile. (E) Plot of freezing time for mice in the contextual FC assay 1, 3 and 17 days after training. (F) Y-maze plot of the percentage of alternations between arms. Each dot (blue or black) represents data from a single animal. *, P < 0.05; **, P < 0.01; ***, P < 0.001; ****, P < 0.0001.
