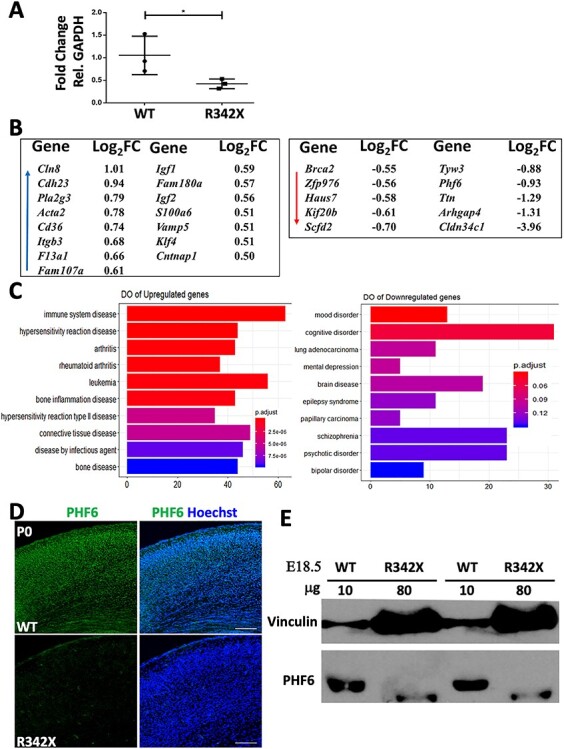
Figure 6 .

Analysis of PHF6 protein and gene expression differences in the P0 cortex. (A) RT-qPCR analysis shows that the R342X mice have reduced Phf6 transcript levels compared with WT littermates (n = 3). RNA levels were normalized to GAPDH expression. *, P < 0.05. (B) List of DEGs (± 0.5 log2 fold change; s-value < 0.005) identified in the R342X P0 cortex. Blue arrow indicates upregulated genes, while red arrow highlights downregulated genes. (C) DO plots of significant disease terms for upregulated (left) and downregulated gene lists (right). (D) Representative image of P0 coronal sections IF stained for PHF6 (green) from WT and R342X mice. Hoechst counterstained nuclei are blue. (E) Immunoblots of E18.5 cortical extracts for PHF6 from WT and R342X mice. Note the increased protein loading in the R342X lanes. Vinculin was used as a protein loading control.
