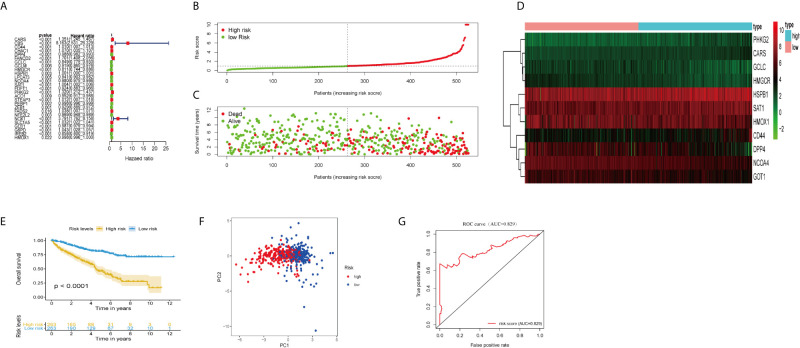
Figure 1.
Construction and validation of the ferroptosis-related genes prognostic signature in ccRCC patients. (A) Univariate Cox regression analysis showed that 27 ferroptosis-related genes were related to the overall survival rate (OS) of ccRCC patients. (B) Distribution of risk scores of high- and low-risk BCLA patients based on the ferroptosis-related genes prognostic signature. (C) The scatter plot showed the correlation between the survival status of high- and low-risk ccRCC patients. (D) The heat map showed the differences in the expression of 11 ferroptosis-related genes between high and low risk patients. (E) Kaplan–Meier survival curve showed that the survival time of the high-risk group was significantly shorter than that of the low-risk score group. (F) PCA showed that 11 ferroptosis-related genes were distributed differently between high-risk groups and low-risk groups. (G) ROC curve analysis of risk score as an independent prognostic factor.

