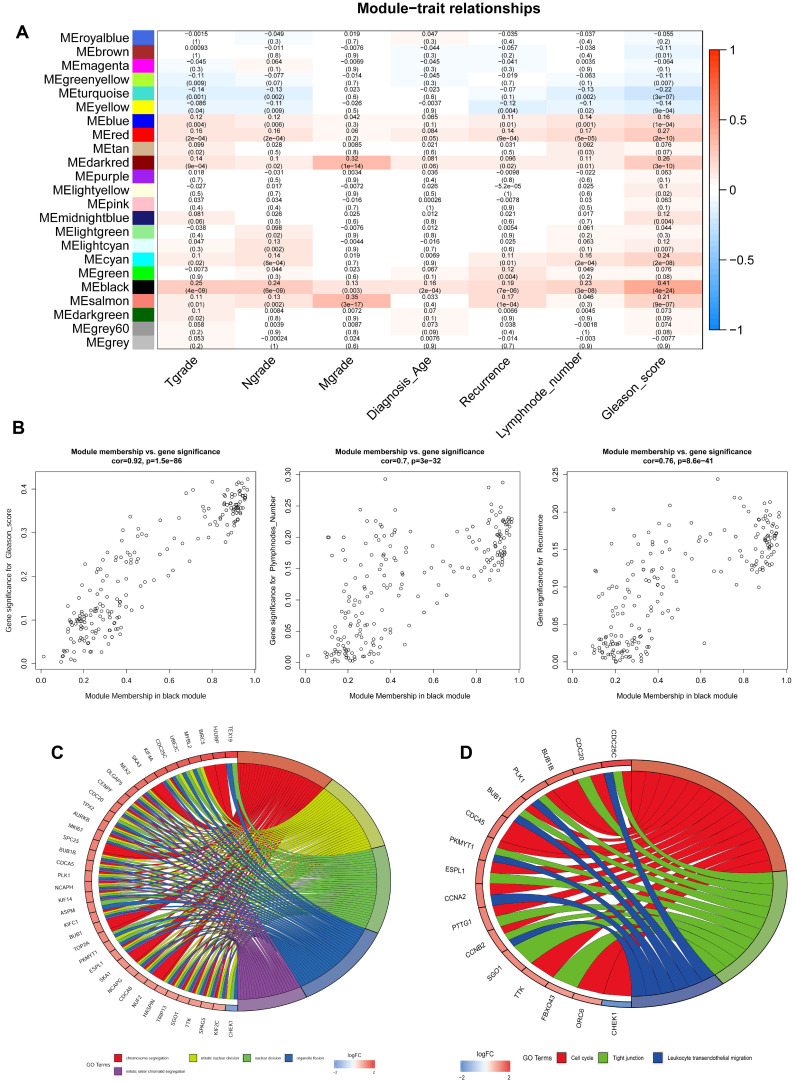
Figure 4.
Identification of key genes and functional annotation of the black module. (A) The correlation between modules and the clinical traits. (B) Scatter plot of module eigengenes in the black module related with Plymphnodes Number (correlation coefficient = 0.7), Recurrence (correlation coefficient = 0.76), and Gleason score (correlation coefficient = 0.92). (C) Chord plot depicted the relationship between genes and GO terms of molecular function. (D) Chord plot indicated the relationship between genes and KEGG pathways.

