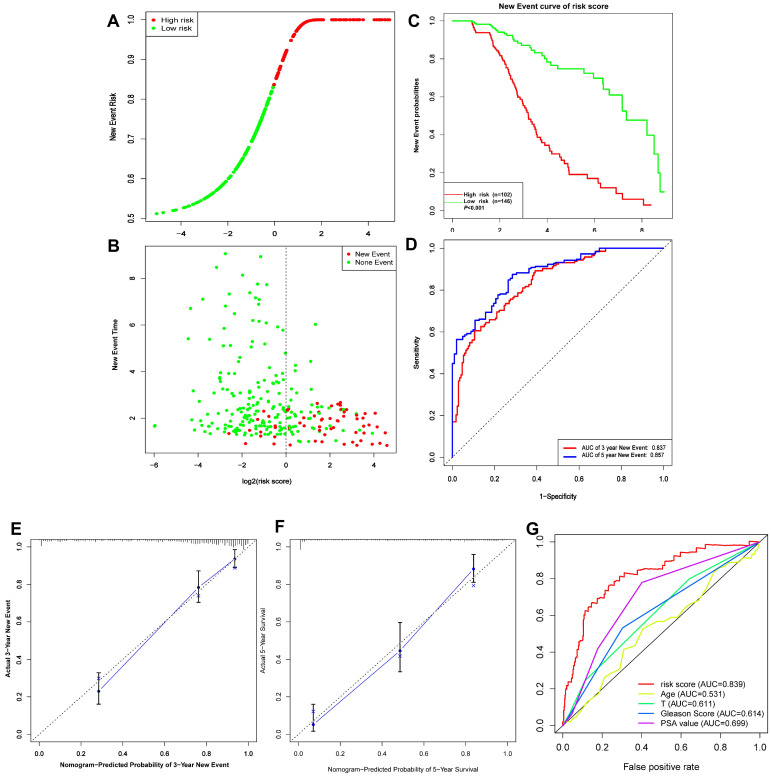
Figure 9.
(A-D) Risk score, KM survival curves and time-dependent ROC curves of DFI in GSE116918 validation cohort. (E-F) Calibration curves of the nomogram for predicting the probability of DFI at 3 and 5 year (G) Multiline ROC curves showed the superiority of 5-gene panel than Age, T classification, Gleason score, and PSA value.

