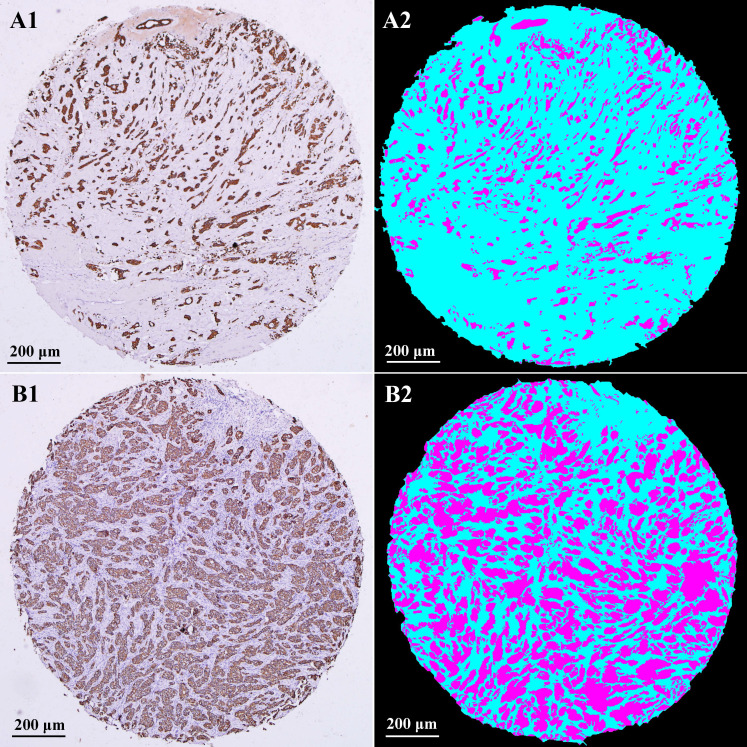
Figure 2.
IHC staining images and computerized assessment results in TMAs. IHC staining of CK could specifically label tumor areas with clear contrast (A1 and B1). After computerized recognition, tumor areas were marked in magenta, stromal areas in cyan, and none-cell areas in black (A2 and B2). Examples of high stroma (A1 and A2); Examples of low stroma (B1 and B2). IHC: immunohistochemistry; CK: cytokeratin; TSR: tumor-stromal ratio.

