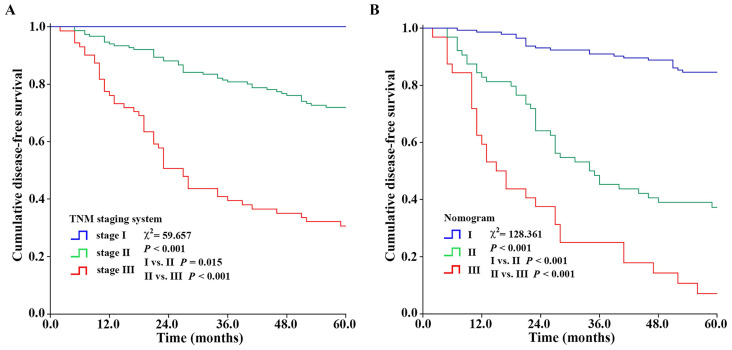
Figure 7.
Kaplan-Meier survival curves showing the stratification of the nomogram and TNM staging system. The nomogram had a better ability to distinguish BC patients into three groups with different prognoses (χ2=128.361, P < 0.001 for I/II and II/III) than the TNM staging system (χ2=59.657, P = 0.015 for I/II, P < 0.001 for II/III).

