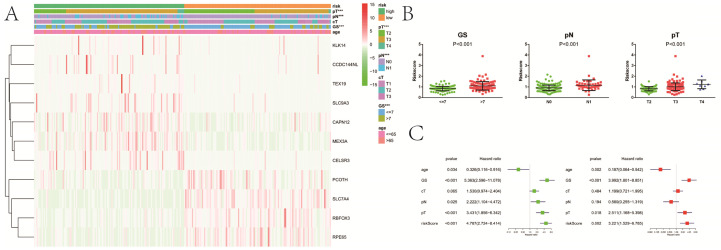
Figure 7.
Relationship between the risk signature and clinicopathologic characters. A, heatmap showing clinicopathologic characters between low- and high-risk group; B, distribution of risk scores in PCa patients stratified by GS, pT and pN; C, univariate and multivariate Cox regression analysis for RFS in PCa patients. GS, Gleason score; pT, pathologic tumor; pN, pathologic lymph node; cT, clinical tumor; RFS, recurrence-free survival. ***P<0.001.

