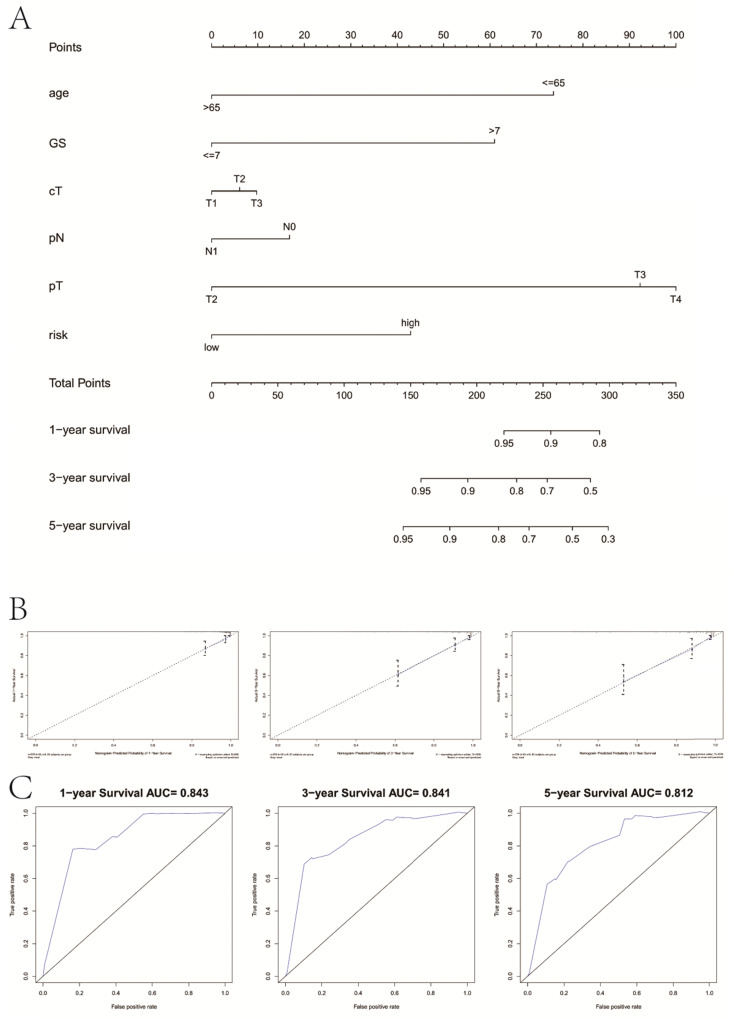
Figure 9.
Combination with clinical variables to build a predictive nomogram. A, Nomogram plot to predict 1-, 3- and 5-year survival; B, Calibration plot of the nomogram to predict 1-, 3- and 5-year survival; C, ROC curves of the nomogram to predict 1-, 3- and 5-year survival. GS, Gleason score; pT, pathologic tumor; pN, pathologic lymph node; cT, clinical tumor.

